Translate this page into:
Use of 4-Dimensional Cone Beam Computed Tomography Scan to Estimate the Planning Target Volume Margin in Lung Tumors
This article was originally published by Thieme Medical and Scientific Publishers Private Ltd. and was migrated to Scientific Scholar after the change of Publisher.
Abstract
Introduction This study aimed to estimate the planning target volume (PTV) margin in lung tumors using 4D computed tomography (CT) scan and evaluate other factors that have an effect on tumor motion.
Materials and Methods We recruited 43 biopsy-proven, newly diagnosed carcinoma lung patients who were treated with definitive intent from January 2017 to June 2018. The radiation dose was delivered using a 3D conformal radiation therapy (CRT)/intensity-modulated radiotherapy (IMRT)/volumetric modulated arc therapy (VMAT) plan to a dose of 6000 to 6600 cGy in 30 or more fractions to the whole primary. All patients underwent 4D CT scan on the Elekta machine where all the 10 phases of respiration in free breathing were recorded. These phases are fused with CT simulation images, on which gross tumor volume (GTV) and clinical target volume (CTV) are contoured in all phases of respiration. Following this, an internal target volume (ITV) was created by measuring tumor motion all the directions from the center of tumor and PTV was concluded.
Results The mean ITV for tumor in all six directions, that is, in superior, inferior, anterior, posterior, medial and lateral directions was 0.9, 0.9, 0.8, 0.9, 0.8, and 0.9 cm, respectively. For coverage of tumor for 90% of patients, the margins required in superior, inferior, anterior, posterior, medial, and lateral directions were 1.3, 1.5, 1.5, 1.4, 1.5, and 1.3 cm, respectively. Other factors such as size of the tumor and location of the tumor did not significantly contribute to PTV changes in our study.
Conclusion Mean ITV for tumor in all six directions summed up to be 0.8 cm, but there was significant movement in inferior direction for upper lobe tumors (0.9 cm) (p = 0.008), in medial direction for middle lobe tumors (0.8 cm) (p = 0.05), and in medial direction for lower lobe tumors (0.75 cm) (p = 0.005).
Keywords
carcinoma lung
respiratory gating
4D cone beam CT scan
internal target volume
planning target volume

Introduction
According to ICMR/NCDIR 2015, there are 1,06,794 lung cancer cases in our country.1 The 5-year overall survival rate is around 18% for lung cancer.2 Respiratory motion management has been gaining interest widely due to intrafraction motion. To obtain the planning target volume (PTV), the addition of the margins should account for intrafraction motion (due to respiration), interfraction motion, and setup errors.3 Conventionally, the respiratory motion is accounted for by adding treatment margins universally to cover the limits of motion of the tumor. But this increases the radiation field size and consequently the volume of healthy tissues exposed to high doses. This increased treatment volume increases the likelihood of treatment-related complications. However, if the margins are not sufficiently large, part of the clinical target volume (CTV) will not receive adequate dose coverage and may result in local failure.4 Hence, the need for the study to estimate the appropriate PTV margins. The European Organization for the Research and Treatment of Cancer (EORTC) guidelines recommend that an assessment of 3D tumor mobility is essential for treatment planning and delivery in lung cancer.5 4D or respiratory-correlated CT using single-slice, multi slice, or cone beam acquisition can provide 3D data on tumor position at several points along the breathing.6 4D data is analyzed to determine the mean tumor position and tumor range of motion which is incorporated for treatment planning.
Objective
This study aimed to estimate the PTV margin in lung tumors using 4D cone beam CT scan and evaluate other factors which affect tumor motion.
Materials and Methods
This is a hospital-based, nonrandomized, single-arm, observational study that was conducted from January 2017 to June 2018. Patients who presented to the department of radiation oncology, with biopsy-proven, newly diagnosed carcinoma in lungs, and planned for definitive radiochemotherapy, were included. Thorough examination was done and clinical history was checked on the patients’ first visit. All the appropriate investigations were also conducted. When all the investigations were within the normal limits, patients’ written consent was taken after explaining the nature of the disease, its treatment options and side effects in the vernacular. Patients were also explained about the current study.
The inclusion criteria were as follows: (a) biopsy-proven lung cancer, both small cell and nonsmall carcinoma of lung; (b) patients treated with definitive radiochemotherapy. The exclusion criteria were as follows: (a) patients who underwent surgery or neoadjuvant chemotherapy; (b) patients with pleural effusion; (c) patients with poor performance status; (d) patients treated with palliative intent.
The patients were simulated using 16 slice wide bore GE CT Scanner and aligned using room lasers. The area to be scanned was localized, and axial CT scans of 2.5 mm or 5 mm slice thickness were acquired. These images were exported to the Monaco Elekta treatment planning system. At the same setting, 4D CT scan of the thoracic region is taken in free breathing pattern on Elekta machine with a slice thickness of 2.5 mm. The 4D sets are sorted out into 10-phase bins within the respiratory cycle, using the advantage of 4D CT application. These images are then transferred to the Elekta treatment planning system.
With the volume of interest taken as the lung tumor, the treatment simulated CT scan images are fused with the 4D CT scan images. The gross tumor volumes (GTVs) are contoured in each of the 10 CT data sets using standardized lung window and soft-tissue level setting; thereafter, each of these phases are copied into the treatment simulated CT, and internal target volume (ITV) is generated. Once the ITV is generated, the maximum shift in all six directions is measured with midpoint of tumor taken as reference. This ITV is applied to get the PTV. Weekly kV imaging was done for evaluation of setup errors but 4D CT scan was not repeated further.
The sample size was estimated in consultation with a biostatistician. The sample size estimated was 43 cases. This was based on a study by Jenelle et al; standard deviation (SD): 2, absolute precision: 0.6, confidence interval: 95%, and required sample size: 43.
Results
A total of 43 patients with newly diagnosed carcinoma of lung were enrolled in the study.
Data was analyzed using SPSS 18 for Windows. Frequency distribution was mapped for categorical data. Data was not normally distributed (Shapiro–Wilks test p < 0.05); therefore, we compared the outcomes with respect to the location of tumor and lobe of lung using nonparametric median test. For tumor size cutoff < 5 cm and above 5 cm, we compared the outcomes using a nonparametric Mann–Whitney test.
Patient and tumor characteristics are shown in Table 1. Patients selected for the study were aged between 35 and 75 years. Mean age of the patients was 50.5 years. The lung tumor was further divided based on the laterality, with number of left-sided tumors being 20 (46.5%) and number of right sided tumors being 23 (53.5%). Movement of tumor in all directions with degree of freedom and significance level are shown in Table 2. Mean ITV for tumor in all six directions summed up to be 0.8 cm, but there was significant movement in inferior direction for upper lobe tumors (0.9 cm) (p = 0.008) as shown in Fig. 1, medial direction for middle lobe tumors (0.8 cm) (p = 0.052), and in medial direction for lower lobe tumors (0.75 cm) (p = 0.005), as shown in Fig. 2. Comparison of mean and SD of setup errors across various lobes of the lung is shown in Table 3. Maximum movement in superoinferior direction was for lower lobe tumors. Maximum movement in anteroposterior direction was for upper lobe tumors. Maximum movement in mediolateral direction was for middle lobe tumors. There was a significant decrease in setup error medially in the lower lobe of lung compared to the upper and middle lobes (χ2 = 6.87, p = 0.032). There was no difference in setup errors in other anatomical directions across lobes. Comparison of mean and SD of setup errors across various locations of lesions in the lung is shown in Table 4. Maximum movement for centrally located tumors is in the inferior direction, hilar tumors in lateral directions, and peripheral tumors in superior directions. There was a near significant decrease in setup error medially in the lower lobe of lung compared to the upper and middle lobes (χ2 = 5.18, p = 0.07). There was no difference in setup errors in other anatomical directions across lobes. Comparison of mean and SD of setup errors across tumor size cutoff ≤ 5 cm is shown in Table 5. There was no change in setup errors with tumor size cutoff ≤ 5 cm.
|
Patient and tumor characteristics |
Number |
Percentage (%) |
|---|---|---|
|
Age distribution (y) |
||
|
31–40 |
4 |
9.40 |
|
41–50 |
11 |
25.60 |
|
51–60 |
13 |
30.20 |
|
61–70 |
13 |
30.20 |
|
71–80 |
2 |
4.60 |
|
Gender distribution |
||
|
Female |
5 |
11.6 |
|
Male |
38 |
88.4 |
|
Laterality of tumor |
||
|
Left |
20 |
46.5 |
|
Right |
23 |
53.5 |
|
Lobe of the tumor |
||
|
Upper lobe |
24 |
55.8 |
|
Middle lobe |
10 |
23.3 |
|
Lowe lobe |
9 |
20.9 |
|
Location of the tumor |
||
|
Central |
16 |
37.2 |
|
Hilar |
7 |
16.3 |
|
Peripheral |
20 |
46.5 |
|
Size of the tumor |
||
|
< 5 cm |
23 |
53 |
|
> 5 cm |
20 |
47 |
|
Statistic |
Degree of freedom |
p-Value |
||
|---|---|---|---|---|
|
Superior (cm) |
Upper lobe |
0.937 |
24 |
0.142 |
|
Middle lobe |
0.878 |
10 |
0.124 |
|
|
Lower lobe |
0.909 |
9 |
0.311 |
|
|
Inferior (cm) |
Upper lobe |
0.880 |
24 |
0.008 |
|
Middle lobe |
0.938 |
10 |
0.532 |
|
|
Lower lobe |
0.957 |
9 |
0.764 |
|
|
Anterior (cm) |
Upper lobe |
0.910 |
24 |
0.036 |
|
Middle lobe |
0.810 |
10 |
0.019 |
|
|
Lower lobe |
0.864 |
9 |
0.106 |
|
|
Posterior (cm) |
Upper lobe |
0.888 |
24 |
0.012 |
|
Middle lobe |
0.885 |
10 |
0.147 |
|
|
Lower lobe |
0.851 |
9 |
0.076 |
|
|
Medial (cm) |
Upper lobe |
0.866 |
24 |
0.004 |
|
Middle lobe |
0.846 |
10 |
0.050 |
|
|
Lower lobe |
0.747 |
9 |
0.005 |
|
|
Lateral (cm) |
Upper lobe |
0.927 |
24 |
0.083 |
|
Middle lobe |
0.972 |
10 |
0.910 |
|
|
Lower lobe |
0.932 |
9 |
0.499 |
|
Lobe region |
Sup (cm) |
Inf (cm) |
Ant (cm) |
Post (cm) |
Med (cm) |
Lat (cm) |
|
|---|---|---|---|---|---|---|---|
|
Upper lobe |
Mean |
0.74 |
0.829 |
0.750 |
0.775 |
0.77 |
0.713 |
|
SD |
0.425 |
0.5229 |
0.3502 |
0.4416 |
0.464 |
0.4416 |
|
|
N |
24 |
24 |
24 |
24 |
24 |
24 |
|
|
Middle lobe |
Mean |
0.75 |
0.850 |
0.740 |
0.770 |
0.77 |
0.800 |
|
SD |
0.314 |
0.3979 |
0.5420 |
0.4668 |
0.403 |
0.3018 |
|
|
N |
10 |
10 |
10 |
10 |
10 |
10 |
|
|
Lower lobe |
Mean |
0.88 |
0.944 |
0.689 |
0.633 |
0.61 |
0.589 |
|
SD |
0.484 |
0.4187 |
0.1900 |
0.4243 |
0.285 |
0.2571 |
|
|
N |
9 |
9 |
9 |
9 |
9 |
9 |
|
|
Total |
Mean |
0.77 |
0.858 |
0.735 |
0.744 |
0.73 |
0.707 |
|
SD |
0.410 |
0.4681 |
0.3709 |
0.4371 |
0.415 |
0.3795 |
|
|
N |
43 |
43 |
43 |
43 |
43 |
43 |
|
Abbreviation: SD, standard deviation.
|
Location of lesion |
Sup (cm) |
Inf (cm) |
Ant (cm) |
Post (cm) |
Med (cm) |
Lat (cm) |
|
|---|---|---|---|---|---|---|---|
|
Central |
Mean |
0.77 |
1.013 |
0.856 |
0.806 |
0.75 |
0.756 |
|
SD |
0.471 |
0.5488 |
0.4179 |
0.5118 |
0.499 |
0.5020 |
|
|
N |
16 |
16 |
16 |
16 |
16 |
16 |
|
|
Hilar |
Mean |
0.79 |
0.829 |
0.714 |
0.743 |
0.86 |
0.914 |
|
SD |
0.334 |
0.3638 |
0.5610 |
0.4721 |
0.336 |
0.2545 |
|
|
N |
7 |
7 |
7 |
7 |
7 |
7 |
|
|
Peripheral |
Mean |
0.77 |
0.745 |
0.645 |
0.695 |
0.68 |
0.595 |
|
SD |
0.400 |
0.4136 |
0.2139 |
0.3734 |
0.374 |
0.2605 |
|
|
N |
20 |
20 |
20 |
20 |
20 |
20 |
|
|
Total |
Mean |
0.77 |
0.858 |
0.735 |
0.744 |
0.73 |
0.707 |
|
SD |
0.410 |
0.4681 |
0.3709 |
0.4371 |
0.415 |
0.3795 |
|
|
N |
43 |
43 |
43 |
43 |
43 |
43 |
|
Abbreviation: SD, standard deviation.
|
Tumor size cutoff 5 cm |
Sup (cm) |
Inf (cm) |
Ant (cm) |
Post (cm) |
Med (cm) |
Lat (cm) |
|
|---|---|---|---|---|---|---|---|
|
<5 cm |
Mean |
0.69 |
0.804 |
0.809 |
0.700 |
0.72 |
0.652 |
|
SD |
0.391 |
0.4637 |
0.3907 |
0.4253 |
0.349 |
0.3073 |
|
|
N |
23 |
23 |
23 |
23 |
23 |
23 |
|
|
> 5 cm |
Mean |
0.87 |
0.920 |
0.650 |
0.795 |
0.76 |
0.770 |
|
SD |
0.418 |
0.4775 |
0.3364 |
0.4559 |
0.489 |
0.4485 |
|
|
N |
20 |
20 |
20 |
20 |
20 |
20 |
|
|
Total |
Mean |
0.77 |
0.858 |
0.735 |
0.744 |
0.73 |
0.707 |
|
SD |
0.410 |
0.4681 |
0.3709 |
0.4371 |
0.415 |
0.3795 |
|
|
N |
43 |
43 |
43 |
43 |
43 |
43 |
|
Abbreviation: SD, standard deviation.
-
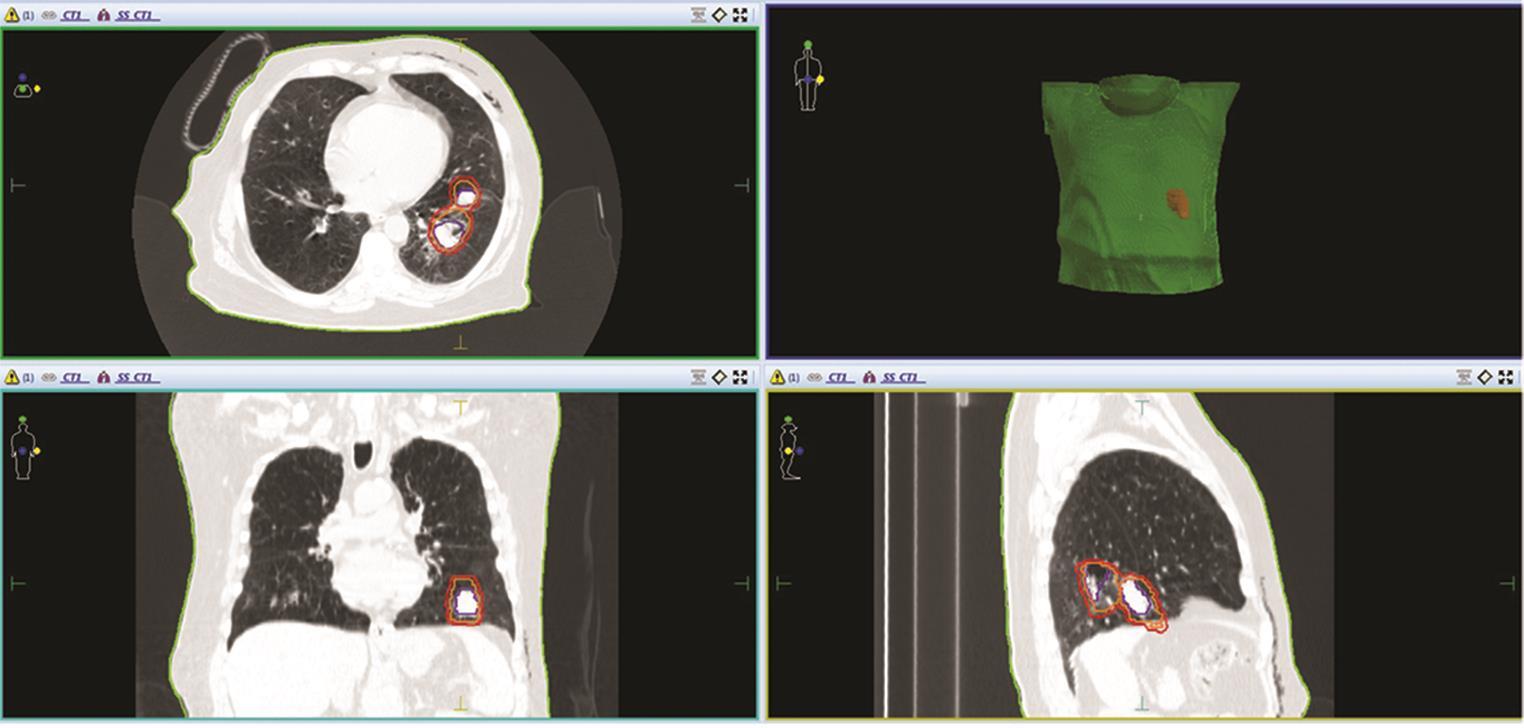
Fig. 1 Contouring of GTV (red color) and ITV (orange color) in left upper lobe lung tumor, with maximum movement in inferior and medial direction in all three sections–axial, coronal and sagittal sections of CT image of a patient. GTV, gross tumor volume; ITV, internal target volume.
-
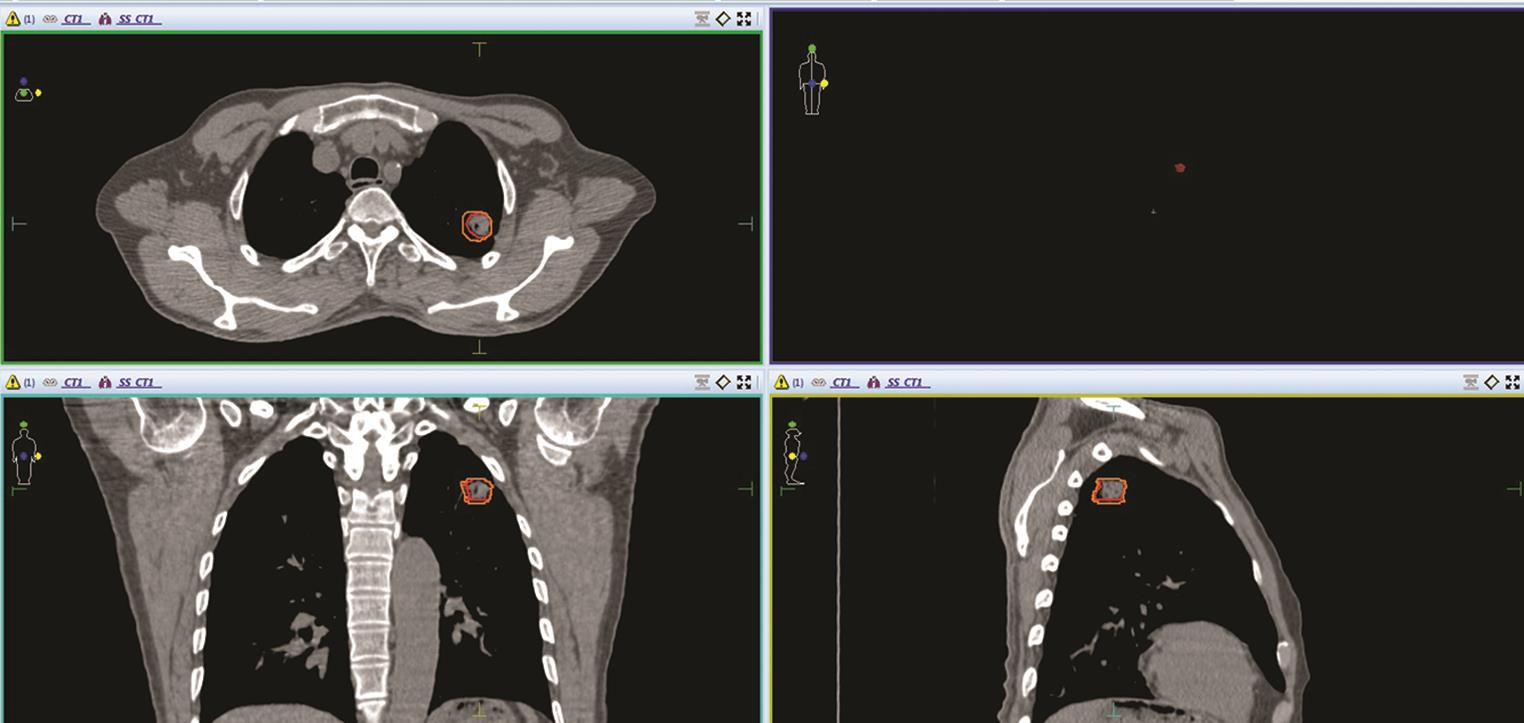
Fig. 2 Contouring of GTV (blue color), ITV (orange color) and PTV (red color) in left lower lobe lung tumor, with maximum movement in medial direction in all three sections–axial, coronal and sagittal sections of CT image of a patient. GTV, gross tumor volume; ITV, internal target volume; PTV, planning target volume.
Discussion
Respiratory motion is observed in all three directions, but to a considerable extent in the craniocaudal direction, which can be up to centimeters. For lung tumors, extent of motion depends on the tumor size, location, lung function, and adherence to surrounding structures.6 There are different methods employed to manage the respirator motion in the treatment of lung cancer. Some centers attempt gating the tumor motion, while others try to encompass with appropriate margin around the tumor. Gated radiotherapy helps reduce the size of the margins and hence allows for dose escalation.7 However, any gating errors will result in geographical target misses and over-irradiation of the healthy lung tissue, resulting in pneumonitis.8
4D CT use has been increasing in the recent era for the motion management of the thorax and abdomen tumors. It provides better spatial and temporal information on the mobility of the tumor and normal structures. Hence, use of 4D CT helps to customize the CTV to ITV margins on a patient-to-patient basis, which improves the therapeutic ratio by increasing the tumor coverage and decreasing the dose to the surrounding normal structure. ITV margin can be obtained by either contouring in all 10 phases of respiration, which is time consuming, or by using maximum intensity projection of all phases. This ITV ensures full irradiation of the target over the entire breathing cycle. For this ITV, further margins are added to give the PTV.9,10
Our study was conducted for newly diagnosed biopsy-proven carcinoma lung patients who are treated with definitive chemoradiation. A total of 43 patients were enrolled. All the patients underwent helical and 4D CT scan. GTV was contoured in all 10 phases of respiration after which ITV was calculated and added to PTV for treatment. According to our study, the mean ITV in superior, inferior, anterior, posterior, medial, and lateral directions was 0.9, 0.9, 0.8, 0.9, 0.8, and 0.9 cm, respectively. But for coverage of tumor for 90% of the patients, the margins required in superior, inferior, anterior, posterior, medial and lateral directions were 1.3, 1.5, 1.5, 1.4, 1.5, and 1.3 cm, respectively. Lobe of tumor with respect to motion did have correlation. Mean ITV for tumor in all six directions summed up to be 0.8 cm, but there was significant movement in inferior direction for upper lobe tumors (0.9 cm), in medial direction for middle lobe tumors (0.8 cm), and in medial direction for lower lobe tumors (0.75 cm).
Other factors such as size of tumor and location of the tumor have been studied too, but there was no statistically significant difference in movement, depending upon the size of the tumor and also the location of the lobe of the tumor, although centrally located tumors had more movement during respiration when compared with peripherally located tumors, but this was not statistically significant either.
Three randomized studies have been assessed and proved that respiratory motion should be taken into account to generate ITV which will further be added to PTV for the treatment of lung cancer patients.
In a study by Jenelle et al, 43 patients undergoing definitive treatment were simulated using 4D CT, patients were positioned using wing board immobilization, and after planning was complete, a cone beam reference was exported containing the ITV as a delineated object. Daily imaging was done using cone beam CT, and the patient was shifted to align the target volume within the ITV, as delineated on the reference images. The patients underwent between 20 and 36 fractions of radiation with a mean of 30 fractions. A total of 1,302 individual cone beam image-guided radiation therapy (IGRT) treatment sessions were analyzed. The mean margin for all patients in each of the primary directions was 4.5 mm (anteroposterior), 4.3 mm (superoinferior), and 3.4 mm (mediolateral). The maximum range was 0 to 11 mm for all primary directions. The study concluded that a margin between 5 and 11 mm should be adequate to ensure coverage in patients who are planned using 4D CT simulation but who are not treated with daily cone beam CT-guided IGRT.11
In another study by Helen et al, they assessed 3D tumor motion and ITV using 4D CT for radiotherapy of lung cancer. Respiration-induced tumor motion was analyzed for 166 tumors from 152 lung cancer patients, 57.2% of whom had stage III or IV nonsmall cell lung cancer. All patients underwent 4D CT during normal breathing before treatment. The expiratory phase of 4D CT images were used as reference set to delineate GTV. GTVs on other respiratory phases and resulting ITVs were determined using rigid body registration of 4D CT images, and also the association of GTV motion with various clinical and anatomic factors were analyzed statistically. The proportion of tumors that moved > 0.5 cm along the superior–inferior (SI), lateral, and anteroposterior axes during normal breathing were 39.2%, 1.8% and 5.4%, respectively. For 95% of tumors, the magnitude of motion was less than 1.34 cm, 0.40 cm and 0.59 cm along the SI, lateral and anteroposterior directions. The principal component of tumor motion was in the SI direction, with only 10.8% of tumors moving > 1.0 cm. The tumor motion was found to be associated with diaphragmatic motion, the SI tumor location in the lung, size of the gross tumor, and disease T stage12
A study by Seppenwoolde et al,13 which had published the most extensive studies on lung tumor motion, evaluated precise and real-time measurement of 3D tumor motion in lung due to breathing and heartbeat during radiotherapy treatment, with 20 patients as sample size. A 2 mm gold marker was implanted in or near the tumor and tracked with real-time tracking system using fluoroscopy over multiple 10 breathing cycles. The 3D position of the implanted gold marker was determined by using real-time pattern recognition and a calibrated projection geometry, and the linac was triggered to irradiate the tumor only when the gold marker was located within a certain volume. The recorded tumor motion was analyzed in terms of amplitude and curvature of the tumor motion in three directions, the differences in breathing level during treatment, hysteresis and the amplitude of the tumor motion induced by cardiac motion. It was found that the average amplitude of motion was greatest in the SI direction (12 ± 2 mm), with much smaller displacements in the medial and dorsal directions (2 ± 1 mm).13
The limitations of our study were mainly 4D CT scan was performed only once before the start of treatment. As patients breathing pattern and tumor size will likely change during course of treatment, multiple sessions of 4D CT are needed to be performed at regular intervals; also, the nature of tumor, if it is well-localized or infiltrative in nature, will change the pattern of margins and also a much huger sample size is required.
To overcome the issue of respiratory motion, if the magnitude of the motion is significantly small, that is, <5 mm of range of motion in any direction, relative to other errors in radiotherapy, the extra effort of using respiratory management techniques is unwarranted, unless significant normal tissue sparing, as determined by your, can be gained with the respiration management technique. The 5 mm motion-limit criterion value was chosen, because this level of motion can cause significant artifacts and systematic errors during imaging procedures. The Task Group recommends that respiratory management techniques be considered if either of the following conditions occur: A greater than 5 mm range of motion is observed in any direction; or significant normal tissue sparing, as determined by your clinic, can be gained through the use of a respiration management technique such as gating; in case of unavailability of gating technique in the department, 4D CT scan can be used to derive individualized patient margins, but if neither of the respiratory motion management techniques are available, then a PTV margin of 2 cm is recommended.14
Conclusion
The use of 4D CT scan for motion management can improve the definition of the target. This will result in reduction of PTV and reduce the chance of missing target and dose to critical structures. But to reach the final conclusion regarding the exact planning target volume, it is recommended to perform a 4D CT scan for individual patients because uniform PTV margins cannot be recommended; also, we needed to perform multiple 4D CT scan sessions during the course of treatment, as patients breathing pattern and size of tumor would likely change during the course of therapy, which would result in large uncertainties in the ITV determination.
Conflict of Interest
None declared.
References
- Mid-ventilation CT scan construction from four-dimensional respiration-correlated CT scans for radiotherapy planning of lung cancer patients. Int J Radiat Oncol Biol Phys. 2006;65(05):1560-1571.
- [Google Scholar]
- The management of respiratory motion in radiation oncology report of AAPM Task Group 76a) Med Phys. 2006;33(10):3874-3900.
- [Google Scholar]
- Radiotherapy Group of European Organization for Research and Treatment of Cancer. Literature-based recommendations for treatment planning and execution in high-dose radiotherapy for lung cancer. Radiother Oncol. 2004;71(02):139-146.
- [Google Scholar]
- Image-guided radiotherapy and motion management in lung cancer. Br J Radiol. 2015;88:20150100. (1051)
- [Google Scholar]
- Impact of fraction size on lung radiation toxicity: hypofractionation may be beneficial in dose escalation of radiotherapy for lung cancers. Int J Radiat Oncol Biol Phys. 2010;76(03):782-788.
- [Google Scholar]
- Adding ipsilateral V20 and V30 to conventional dosimetric constraints predicts radiation pneumonitis in stage IIIA-B NSCLC treated with combined-modality therapy. Int J Radiat Oncol Biol Phys. 2010;76(01):110-115.
- [Google Scholar]
- Use of maximum intensity projections (MIP) for target volume generation in 4DCT scans for lung cancer. Int J Radiat Oncol Biol Phys. 2005;63(01):253-260.
- [Google Scholar]
- Use of maximum intensity projections for target outlining in 4DCT radiotherapy planning. J Thorac Oncol. 2008;3:1433-143.
- [Google Scholar]
- Evaluation of PTV margin in the treatment of lung cancer simulated with 4D CT and validated with daily cone beam CT guidance. Int J Radiat Oncol Biol Phys. 2013;87(02):S718-S719.
- [Google Scholar]
- Assessing respiration-induced tumor motion and internal target volume using four-dimensional computed tomography for radiotherapy of lung cancer. Int J Radiat Oncol Biol Phys. 2007;68(02):531-540.
- [Google Scholar]
- Precise and real-time measurement of 3D tumor motion in lung due to breathing and heartbeat, measured during radiotherapy. Int J Radiat Oncol Biol Phys. 2002;53(04):822-834.
- [Google Scholar]
- The management of respiratory motion in radiation oncology report of AAPM Task Group 76. Med Phys. 2006;33(10):3874-3900.
- [Google Scholar]