Translate this page into:
Serum microRNA-210 as a predictor of neoadjuvant chemotherapy resistance in breast cancer
Corresponding author: Dr. Maher Soliman, Oncology Department, Faculty of Medicine, Alexandria University, Alexandria, Egypt. maher.soliman@daad-alumni.de
-
Received: ,
Accepted: ,
How to cite this article: Naeem D, Abdelaziz HK, Barghash NA, Soliman M, Mannaa HF. Serum microRNA-210 as a predictor of neoadjuvant chemotherapy resistance in breast cancer. Asian J Oncol, 2023;9:10.
Abstract
Objectives
Breast cancer (BC) is a major global health issue as it is the most common malignancy in women. Despite, the role of neoadjuvant chemotherapy (NAC) in early BC has been established, there is a non-small proportion of patients who might develop chemoresistance. Several studies have investigated the relationship between microRNA-210 (miRNA-210) and neoadjuvant chemoresistance in BC with controversial results. Thus, this study aimed to evaluate the role of miRNA-210 as a predictor for chemoresistance in BC receiving NAC.
Material and Methods
The study enrolled 15 chemo-sensitive and 15 chemo-resistant patients with BC receiving NAC. In addition, 10 newly-diagnosed BC patients before treatment and 10 healthy women were recruited as controls. Serum samples from all patients and controls were withdrawn and measurements of miRNA-210 levels using quantitative real-time reverse transcriptase-polymerase chain reaction (qRT-PCR) were done and compared.
Results
The median value of miRNA-210 level was 1.53, 0.27, 0.52, and 1.35 in chemo-sensitive, chemo-resistant, newly-diagnosed, and control groups, respectively. A statistically significant difference (Chi square = 9.801, p = 0.020, df = 3) was found in the mean serum miRNA-210 among the four different groups. Using logistic regression model, low serum miRNA-210 expression level was found to be a predictive factor of chemo-resistance with p = 0.038 (OR of 0.103, 95% CI = 0.012 –0.886). Using the receiver operating characteristic curve, it was found that the area under the curve (AUC) was 0.747 (95% CI = 0.550 –0.943).
Conclusion
Serum miRNA-210 could be an effective predictive biomarker for chemoresistance in BC patients receiving NAC.
Keywords
Biomarker
Breast cancer
Chemoresistance
microRNA

INTRODUCTION
Worldwide, breast cancer (BC) remains the most frequently diagnosed invasive cancer and the leading cause of cancer-related deaths among women.[1] Currently, neoadjuvant chemotherapy (NAC) plays an important role in the treatment of early/locally advanced BC, especially in triple-negative and Her2-positive BC.[2,3] NAC offers several advantages including reduction in tumor size to improve resectability, increase the rate of conservative breast surgery, reduction in the extent of axillary surgery, and early treatment of micrometastatic disease. Moreover, NAC can provide information about the tumor’s behavior in vivo and achieving pathological complete response (CR) at the time of surgery represents an important surrogate marker for beneficial overall survival.[4,5]
Unfortunately, there is no available method that definitely differentiates chemotherapy responders from nonresponders, despite the presence of a nonsmall proportion of patients who will not respond to chemotherapy. Thus, reliable and effective predictive biomarkers for identification of patients with chemoresistance to NAC are urgently needed to avoid unnecessary toxicity of ineffective chemotherapy.
MicroRNAs (miRNAs) are a kind of endogenous small noncoding RNA molecules (19–25 nucleotides) that are involved in the regulation of proliferation, differentiation, apoptosis, angiogenesis, and metastasis of cancer cells. MiRNAs are stably present in the peripheral blood, and various methods can be utilized for determination of their levels.[6,7] The emergence of miRNAs as regulators of gene expression suggests that they might be able to serve as novel diagnostic, prognostic, and predictive biomarkers for therapeutic response in BC. Increasing evidence has suggested an association between aberrant expression of miRNAs and chemotherapy response or resistance in BC.[8–11]
Among the large number of miRNAs, microRNA-210 (miRNA-210) has received special interest since it is engaged in variable biological activities that occur all over the human body. The expression level of miRNA-210 was found to be upregulated or downregulated in BC, thereby functioning as a tumor suppressor gene or oncogene.[12,13] In addition, miRNA-210 expression level has been suggested to be linked to hypoxia, chemoresistance, and poor prognosis.[14-16]
Several studies have shown an association between miRNA-210 and chemotherapy resistance in BC. However, the conclusions from these studies are inconsistent and contradictory.[17-19] Therefore, this study aimed to evaluate the role of serum level of miRNA-210 as a predictor for chemoresistance in patients with BC receiving NAC.
MATERIAL AND METHODS
Subjects
Forty pathologically proven BC patients, who were presented to the oncology department, Alexandria Main University Hospital during the year 2020, were prospectively enrolled in this study. Moreover, 10 age-matched healthy women were recruited from the outpatient clinic as a control group. Patients with BC were allocated to three different groups. The first group included 15 patients with chemosensitive BC to NAC. The second group enrolled 15 patients with chemoresistant BC to NAC. The third group comprised 10 newly diagnosed BC patients before start of treatment. The first two groups were allowed to receive four cycles of Docetaxel and Cyclophosphamide (TC) regimen as NAC. Patients with CR and partial response (PR) were considered as chemosensitive and those with stable disease (SD) and progression disease (PD) were defined as chemoresistant based on response evaluation criteria in solid tumors (RECIST), version 1.1.[20] All controls underwent mammography and/or ultrasonography which had to be free. The demographic and clinicopathological data were obtained. The study was conducted in accordance with the local institutional ethical guidelines and a signed informed consent was obtained from each woman included in the study.
Sample Collection
From every patient and control subject, 5 mL of venous blood was withdrawn. Each blood sample was drawn on a plain test tube. Blood was allowed to clot, and then centrifuged at 1200 g for 10 minutes to separate serum sample, which was kept frozen at −20°C until use.
Extraction of total RNA
Total RNA isolation from serum samples was implemented with the Qiagen® miRNeasy Mini Kit (Qiagen, CA) according to the manufacturer’s instructions. QIAzol Lysis Reagent is added to serum samples. After addition of chloroform, the lysate splits into aqueous and organic phases by centrifugation (RNA partitions to the upper aqueous phase, DNA partitions to the interphase, and proteins to the lower organic phase).
The upper, aqueous phase is extracted, and ethanol is added to facilitate binding for all RNA molecules from approximately 18 nucleotides upward. The sample is then added to the RNeasy MinElute spin column, where the total RNA binds to the membrane and phenol and other contaminants are efficiently washed away. High-quality RNA is extracted as RNA elution in a small volume of RNase-free water.
To normalize the serum RNA extraction efficiency, a synthesized Caenorhabditis elegans miRNA mimic (cel-miR-39) was added to samples during the extraction step to control for variations during the preparation of total RNA and subsequent steps and for normalization of real-time RT-PCR results of endogenous miRNAs in the sample.
RNA quantitation and quality assessment
The concentration and purity of RNA were measured at 230, 260, and 280 nm by the use of NanoDrop 2000/2000c spectrophotometer (Thermo Scientific, USA). Ratio of A260/A280 = 1.8–2.1 and A260/A230 = 1.8–2.1 indicates highly pure RNA.
Real-time quantitative reverse transcription-polymerase chain reaction (qRT-PCR)
Quantification of miRNA-210 expression using the TaqMan MiRNA Assays was carried out using RT-PCR. cDNA was reverse transcribed from purified RNA samples by the use of specific miRNA stem loop primers from the TaqMan MiRNA Assays and reagents from the TaqMan® MiRNA Reverse Transcription Kit. Then, PCR products were amplified from cDNA samples using the TaqMan miRNA Assay together with the TaqMan® Universal PCR Master Mix. RT-PCR was carried out using Applied Biosystems StepOne™ Real-time PCR System. In the real-time PCR system software, a 20 µL sample using standard run mode under thermal cycling conditions was created.
Relative quantification of miRNA-210 expression
For each sample, the difference in CT values for miRNA-210 (target) and miRNA-39 (spike in control) is calculated (the ΔCT). Next, subtraction of the average Δ CT of control group from the calculated ΔCT of each sample yields the ΔΔCT. The negative value of this subtraction (the –ΔΔCT) is used as the exponent of two in the equation (2–ΔΔCT) and represents the difference in “corrected” number of cycles to threshold.[21] If relative quantification of miRNA-210 >1.0, this was considered as high expression in BC patients relative to the control. While relative quantification of miRNA-210 <1.0 was considered as low expression relative to the control.
Statistical analysis
The analysis was done using SPSS software version 22 (http://www.ibm.com). Age and miRNA-210 were considered as continuous variables. Patients were categorized into different groups according to tumor characteristics as follows; estrogen receptors (negative versus positive), progesterone receptors (negative versus positive), Her2 (negative versus positive), lymphovascular invasion (negative versus positive), tumor grade (II versus III), and clinical stage (II versus III). Chi-square analyses were used for comparisons of categorical variables. For continuous variables, the nonparametric Kruskal–Wallis test was performed for comparison between different groups. Mann–Whitney test was used for pairwise comparison, with Tukey correction as post-hoc analysis. A univariate logistic regression analysis was also performed to estimate odds ratios (ORs) and 95% confidence intervals (CIs). For prediction of cutoff values of miRNA-210, the receiver operating characteristic (ROC) curve was generated and the area under the curve (AUC) was calculated. A p-value < 0.05 was considered statistically significant.
RESULTS
Characteristics of patients
There was no statistically significant difference between different BC groups regarding the different clinical parameters, namely, age, estrogen receptors, progesterone receptors, Her2, lymphovascular invasion, grade and clinical stage, as shown in Table 1.
| Chemosensitive | Chemoresistant | Newly diagnosed | p value | ||||
|---|---|---|---|---|---|---|---|
| n = 15 | (%) | n = 15 | (%) | n = 10 | (%) | ||
| Age (y), median (range) | 51 (34–65) | 52 (38–65) | 52.5 (46–63) | 0.535 | |||
| MiRNA-210 (mean) | 1.75 | 0.24 | 0.72 | 0.020 | |||
| ER | 0.267 | ||||||
| negative | 6 | 40 | 3 | 20 | 5 | 50 | |
| positive | 9 | 60 | 12 | 80 | 5 | 50 | |
| PR | 0.714 | ||||||
| negative | 8 | 53.3 | 6 | 40 | 4 | 40 | |
| positive | 7 | 46.7 | 9 | 60 | 6 | 60 | |
| Her2-neu | 0.267 | ||||||
| negative | 3 | 20 | 6 | 40 | 5 | 50 | |
| positive | 12 | 80 | 9 | 60 | 5 | 50 | |
| LVI | 0.550 | ||||||
| negative | 11 | 73.3 | 13 | 86.7 | 7 | 70 | |
| positive | 4 | 26.7 | 2 | 13.3 | 3 | 30 | |
| Grade | 0.174 | ||||||
| II | 11 | 73.3 | 6 | 40 | 5 | 50 | |
| III | 4 | 26.7 | 9 | 60 | 5 | 50 | |
| Stage | 0.209 | ||||||
| II | 13 | 86.7 | 4 | 26.7 | 8 | 80 | |
| III | 2 | 13.3 | 11 | 73.3 | 2 | 20 | |
Abbreviations: ER, estrogen receptors; PR, progesterone receptors; Her2, human epidermal growth factor receptor 2; LVI, lymphovascular invasion (negative versus positive).
Serum miRNA-210 expression level in the studied groups
As demonstrated in Figure 1a, the median value of miRNA-210 level was 1.53, 0.27, 0.52, and 1.35 in chemosensitive, chemoresistant, newly diagnosed and control groups, respectively.
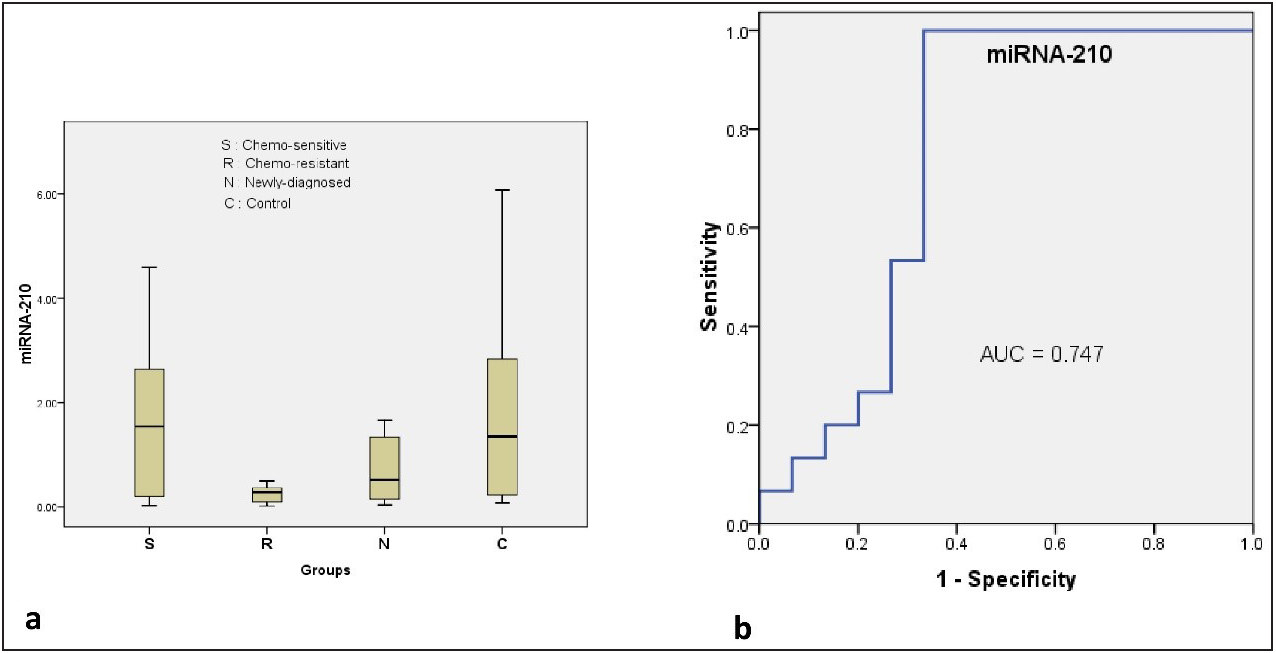
- (a) Box plot shows the difference between different groups regarding the miRNA-210 expression levels; (b) ROC curve shows the sensitivity and specificity of miRNA-210 in prediction of chemoresistance.
Using Kruskal–Wallis Test, a statistically significant difference (Chi square = 9.801, p = 0.020, df = 3) was found in the mean serum miRNA-210 among the four different groups (chemosensitive, chemoresistant, newly diagnosed, and control). There was a statistically significant decrease in the expression level of miRNA-210 in the chemoresistant group compared to the control (p = 0.009) and chemosensitive groups (p = 0.015) using Mann–Whitney U test for pairwise comparison, with Tukey correction [Table 2].
| (I) Group | (J) Group | Mean Difference (I-J) | SE | p | 95% Confidence Interval | |
|---|---|---|---|---|---|---|
| Lower | Upper | |||||
| Chemo-sensitive | Newly diagnosed | 1.023 | 0.534 | 0.236 | −0.401 | 2.447 |
| Control | −0.283 | 0.534 | 0.951 | −1.707 | 1.141 | |
| Chemo-resistant | Chemo-sensitive | −1.504* | 0.478 | 0.015 | −2.777 | −0.23 |
| Control | –1.786* | 0.534 | 0.009 | –3.211 | –0.362 | |
| Newly diagnosed | Chemo-resistant | 0.481 | 0.534 | 0.805 | −0.944 | 1.905 |
| Control | −1.306 | 0.585 | 0.130 | −2.866 | 0.254 | |
Abbreviations: SE, standard error deviation.
Sensitivity and specificity of serum miRNA-210 as a predictive biomarker
Using logistic regression model, low serum miRNA-210 expression level was found to be a predictive factor of chemoresistance with p = 0.038 (OR of 0.103, 95% CI = 0.012 –0.886). By plotting ROC curve [Figure 1b], it was found that the AUC was 0.747 (95% CI: 0.550 – 0.943) and the optimum cutoff value was 0.525 for serum miRNA-210 to predict chemoresistance with a sensitivity of 100% and a specificity of 66.7%.
DISCUSSION
BC has a significant impact on public health, as it is the most common cancer and the main cause of cancer-related deaths in females, globally.[1] To improve the clinical outcome for BC patients, reliable predictive biomarkers are urgently warranted to determine early response to NAC, which is considered an essential prerequisite for innovative personalized treatment concepts. Because of its presence in peripheral blood and physiological fluids and its stability, miRNA-210 might be a new promising predictive biomarker for BC.[17]
In the present study, serum level of miRNA-210 was significantly lower in chemoresistant BC patients compared to those with chemosensitive BC and control groups. The relationship between miRNA-210 expression and chemoresistance is still debatable, given the variability of results among different studies. The disparities in results reported in the literature are most likely attributable to differences in characteristics of patient, various ethnicities, relatively small sample size of each single study, detection technology, cutoff definition of miRNA-210, the heterogeneous selection of internal or exogenous control genes, tested body fluid, and the different methodologies in these published studies. Moreover, the amount of platelets and microparticles left over after plasma processing could affect miRNA-210 measurements.
Consistent with our results, Zhang et al.[22] reported that miRNA-210 expression was elevated in the pathological responders (p = 0.017) compared with that in the nonresponders in luminal BC patients receiving NAC. In contrast to our results, Shao et al.[23] found that miRNA-210 significantly increased (p < .001) in the chemoresistant group in the plasma of metastatic BC patients and also was significantly higher than that in the healthy controls. In another report, Jung et al.[24] found miRNA-210 expression at baseline was significantly higher in Her2-positive BC patients with residual disease than in those achieving pathological CR.
The role of miRNA-210 in NAC remains controversial and is a subtype-related disparity that needs further research. The limitations of the present study should be highlighted. The small sample size of the present study compromised the power of the analysis, In addition, we did not focus on a specific subtype of BC to minimizing the confounding effect of disease biology. Furthermore, patients with Her2-positive BC did not receive trastuzumab targeted therapy.
CONCLUSION
In conclusion, the present study suggested that serum miRNA-210 could be an effective predictive biomarker for the prediction of chemoresistance in BC patients receiving NAC. However, larger prospective, multi-institutional studies are warranted in the future to validate this finding.
Declaration of patient consent
The authors certify that they have obtained all appropriate patient consent.
Financial support and sponsorship
Nil.
Conflicts of interest
There are no conflicts of interest.
REFERENCES
- Global cancer statistics 2018: GLOBOCAN estimates of incidence and mortality worldwide for 36 cancers in 185 countries. CA Cancer J Clin. 2018;68:394-424.
- [CrossRef] [PubMed] [Google Scholar]
- Standard neoadjuvant treatment in early/locally advanced breast cancer. Breast Care (Basel). 2018;13:244-9.
- [CrossRef] [PubMed] [PubMed Central] [Google Scholar]
- Neoadjuvant management of early breast cancer: a clinical and investigational position statement. Oncologist. 2019;24:603-11.
- [CrossRef] [PubMed] [PubMed Central] [Google Scholar]
- Pathologic complete response as a potential surrogate for the clinical outcome in patients with breast cancer after neoadjuvant therapy: A meta-regression of 29 randomized prospective studies. J Clin Oncol. 2014;32:3883-91.
- [CrossRef] [PubMed] [Google Scholar]
- Pathological complete response and long-term clinical benefit in breast cancer: The CTNeoBC pooled analysis. Lancet. 2014;384:164-72.
- [CrossRef] [PubMed] [Google Scholar]
- OncomiRs - microRNAs with a role in cancer. Nat Rev Cancer. 2006;6:259-69.
- [CrossRef] [PubMed] [Google Scholar]
- OncomiRs: the discovery and progress of microRNAs in cancers. Mol Cancer. 2007;6:60.
- [CrossRef] [PubMed] [PubMed Central] [Google Scholar]
- Exploring circulating micro-RNA in the neoadjuvant treatment of breast cancer. Int J Cancer. 2016;139:12-22.
- [CrossRef] [PubMed] [PubMed Central] [Google Scholar]
- Clinical theragnostic relationship between drug-resistance specific miRNA expressions, chemotherapeutic resistance, and sensitivity in breast cancer: a systematic review and meta-analysis. Cells. 2019;8:1250.
- [CrossRef] [PubMed] [PubMed Central] [Google Scholar]
- Serum microRNA-21 predicted treatment outcome and survival in HER2-positive breast cancer patients receiving neoadjuvant chemotherapy combined with trastuzumab. Cancer Chemother Pharmacol. 2019;84:1039-49.
- [CrossRef] [PubMed] [Google Scholar]
- The role of miRNAs in drug resistance and prognosis of breast cancer formalin fixed paraffin-embedded tissues. Gene. 2016;595:221-6.
- [CrossRef] [PubMed] [Google Scholar]
- High expression of microRNA-210 is an independent factor indicating a poor prognosis in Japanese triple-negative breast cancer patients. Jpn J Clin Oncol. 2012;42:256-63.
- [CrossRef] [PubMed] [Google Scholar]
- Global microRNA expression profiling identifies mir-210 associated with tumor proliferation, invasion and poor clinical outcome in breast cancer. PLoS One. 2011;6:e20980.
- [CrossRef] [PubMed] [PubMed Central] [Google Scholar]
- miR-210: Fine-tuning the hypoxic response. Adv Exp Med Biol. 2014;772:205-27.
- [CrossRef] [PubMed] [PubMed Central] [Google Scholar]
- miR-210, a modulator of hypoxia-induced epithelial-mesenchymal transition in ovarian cancer cell. Int J Clin Exp Med. 2015;8:2299-307.
- [PubMed] [PubMed Central] [Google Scholar]
- The role of hypoxia-induced miR-210 in cancer progression. Int J Mol Sci. 2015;16:6353-72.
- [CrossRef] [PubMed] [PubMed Central] [Google Scholar]
- Plasma microRNA 210 levels correlate with sensitivity to trastuzumab and tumor presence in breast cancer patients. Cancer. 2012;118:2603-14.
- [CrossRef] [PubMed] [PubMed Central] [Google Scholar]
- Changes in serum levels of miR-21, miR-210, and miR-373 in HER2-positive breast cancer patients undergoing neoadjuvant therapy: a translational research project within the Geparquinto trial. Breast Cancer Res Treat. 2014;147:61-8.
- [CrossRef] [PubMed] [Google Scholar]
- Candidate miRNAs in human breast cancer biomarkers: a systematic review. Breast Cancer. 2018;25:198-205.
- [CrossRef] [PubMed] [Google Scholar]
- New response evaluation criteria in solid tumours: revised RECIST guideline (version 1.1) Eur J Cancer. 2009;45:228-47.
- [CrossRef] [PubMed] [Google Scholar]
- Comparison of protocols and RNA carriers for plasma miRNA isolation. Unraveling RNA carrier influence on miRNA isolation. Plos one. 2017;12:e0187005.
- [CrossRef] [PubMed] [PubMed Central] [Google Scholar]
- Circulating microRNAs as indicators in the prediction of neoadjuvant chemotherapy response in luminal B breast cancer. Thorac Cancer. 2021;12:3396-406.
- [CrossRef] [PubMed] [PubMed Central] [Google Scholar]
- Plasma microRNAs predict chemoresistance in patients with metastatic breast cancer. Technol Cancer Res Treat. 2019;18:1533033819828709.
- [CrossRef] [PubMed] [PubMed Central] [Google Scholar]
- Plasma microRNA 210 levels correlate with sensitivity to trastuzumab and tumor presence in breast cancer patients. Cancer. 2012;118:2603-14.
- [CrossRef] [PubMed] [PubMed Central] [Google Scholar]