Translate this page into:
Clinical significance of notch receptors, NPR3, and DLL-3 in pediatric and adult medulloblastoma patients
* Corresponding author: Dr. Trupti Trivedi, Department of Cancer Biology, The Gujarat Cancer and Research Institute, Ahmedabad, Gujarat, India. truptitrivedi99@yahoo.ca
-
Received: ,
Accepted: ,
How to cite this article: Mistry MR, Trivedi DA, Bhalala NK, Trivedi T. Clinical significance of notch receptors, NPR3, and DLL-3 in pediatric and adult medulloblastoma patients. Asian J Oncol. 2025;11:8. doi: 10.25259/ASJO_64_2024
Abstract
Objectives
This study aimed to investigate the expression of key genes (Notch-1, Notch-2, Notch-3, Notch-4, DLL1, DLL3, and NPR3) in the Notch signaling pathway in medulloblastoma tumors, and explore their correlation with clinicopathological features, including patient survival outcomes.
Material & Methods
A total of 103 histologically confirmed medulloblastoma tumor samples were analyzed using quantitative Real-time polymerase chain rection (qPCR) to assess the expression levels of the seven Notch pathway genes. The relationship between gene expression and various clinicopathological parameters, including tumor location, patient age, gender, and risk group classification, was examined. Statistical analyses were performed using SPSS software, with p-values ≤ 0.05 considered statistically significant. Progression-free survival (PFS) and overall survival (OS) were also analyzed to determine the clinical impact of gene expression levels.
Results
The study revealed varying levels of upregulation for the Notch pathway genes in medulloblastoma tumors: Notch-1 (38%), Notch-2 (58%), Notch-3 (82%), Notch-4 (33%), DLL1 (69%), DLL3 (71%), and NPR3 (57%). Notably, Notch-3 expression was significantly associated with tumors located in the occipital region (p=0.04). A significant inverse correlation was found between high-risk patients and Notch-4 upregulation (p=0.05). DLL3 expression showed significant inverse correlations with gender (p=0.03) and risk group classification (p=0.04), but a positive correlation with the primary tumor site (p=0.003). NPR3 expression was inversely correlated with patient age (p=0.01). Furthermore, all Notch receptors and ligands demonstrated positive intercorrelations, suggesting a coordinated role in tumor biology. Survival analysis showed that patients in the average-risk group had significantly higher recurrence rates at both 12 and 24 months compared to high-risk patients (p<0.01). Notably, patients who received only radiotherapy post-surgery had lower recurrence rates and better survival outcomes, with significantly lower incidences of death at 12 months (p=0.005) and 24 months (p=0.03).
Conclusion
The findings highlight the potential clinical significance of Notch-3, Notch-4 receptors, and DLL3 as key biomarkers in medulloblastoma. These genes offer promising targets for developing more personalized and effective treatment strategies. Further research into their precise role in tumor progression and response to therapy is warranted.
Keywords
High risk
Medulloblastoma
Notch signalling pathway
OS
PFS

INTRODUCTION
Medulloblastoma (MB) is the most common malignant pediatric brain tumor, arising in the cerebellum. The World Health Organization (WHO) CNS5 classification categorizes MB into four molecular subgroups: WNT-activated, SHH-activated (TP53-wildtype/mutant), and non-WNT/non-SHH (groups 3 and 4).[1] According to data from The Central Brain Tumor Registry of the United States Statistical Report, the most common MB subtype was Sonic Hedgehog [SHH]-activated & TP53-wildtype [included in the SHH group], followed by Non-WNT/non-SHH MB [including both group 3/group C and group 4/group D]. Despite advances in multimodal therapy, a subset of MB remains incurable, with survivors often facing long-term cognitive and physiological impairments.[2,3]
The Notch signaling pathway plays a key role in neural development, regulating proliferation, differentiation, and apoptosis.[4] Initially identified in Drosophila, Notch receptors (Notch-1, Notch-2, Notch-3, Notch-4) and ligands (DLL1, DLL3) influence tumorigenesis in a context-dependent manner, acting as oncogenic drivers in some cancers and tumor suppressors in others. However, its role in MB remains unclear.[5]
This study investigates the expression of seven Notch pathway genes, Notch-1, Notch-2, Notch-3, Notch-4, DLL1, DLL3, and NPR3 in 103 MB formalin-fixed, paraffin-embedded (FFPE) tissue samples using real-time polymerase chain reaction (RT-PCR). Understanding Notch signaling in MB may provide insights into its pathogenesis and therapeutic potential.
MATERIAL & METHODS
Ethics approval and informed consent
This study was reviewed and approved by the Institutional Ethics Committee [Ref# EC-BHR-O-21-2020]. The study obtained informed consent from each individual participant.
Patients
A total of 103 untreated newly diagnosed patients with histologically confirmed MB tumors registered at The Gujarat Cancer & Research Institute, Ahmedabad, India, from January 2015 to September 2022 were enrolled in the current retrospective study. Detailed clinical and pathological history of enrolled patients was obtained from the case files maintained at the Medical Record Department of the institute. The clinical and pathological characteristics of the enrolled patients are listed here. Sixty-eight percent of patients were male, and 80 percent were pediatric. Patients included in this study were those with histologically confirmed MB who were newly diagnosed and had not received any prior treatment. Only patients with complete clinical and pathological records were considered for inclusion. Exclusion criteria encompassed individuals with a history of prior treatment for MB, cases with incomplete clinical or pathological data, and patients diagnosed with other concurrent malignancies
Patients < 3 years of age, with metastasis at diagnosis, or residual tumors >1.5 cm2 in the area are considered high-risk group patients, while patients not meeting these criteria are considered in the average-risk group, as per the established risk stratification guidelines.[6] Here, 77% [79/103] patients are in the high-risk group. All patients underwent surgery as primary treatment. Fifty-three percent of patients had taken radiotherapy and/or chemotherapy as adjuvant therapy. Based on the primary tumor site of MB, there are five different sites, including posterior fossa sol, sub-occipital region, occipital, cerebellum region, and 4th ventricle. In the present study, 37% [38/103] of patients’ tumors were located at the posterior fossa sol.
RNA extraction and gene expression analysis
FFPE blocks from the same patients were collected from the pathology department of the institute and subjected to ribonucleic acid (RNA) extraction using the High Pure formalin fixed paraffin embedded tissue (FEPET) RNA Isolation Kit [Roche Life Science]. RNA extraction was carried out for RT-PCR analysis of Notch signaling pathway gene expression. Subsequently, the Qubit Fluorometer [Invitrogen, USA] was employed to measure RNA concentrations.
Gene expression of the notch signaling pathway using real-time PCR
For Notch signaling pathway gene expression detection, complementary deoxyribonucleic acid (cDNA) synthesis was performed using the High-Capacity cDNA Reverse Transcription Kit with 1 µg RNA. Rotor-Gene Q 5-plex HRM instrument [Qiagen] was utilized for relative quantification.[7] Amplification involved QuantiTect SYBR Green RT-PCR Kit, with 0.4 µl each of forward and reverse primers [Table 1] and 10 µl SYBR Green RT-PCR Master Mix in a total 20 µL reaction volume. The protocol included an initial denaturation step at 95°C for 15 minutes, followed by 45 cycles at 95°C for 15 seconds, 60°C for 30 seconds, and 72°C for 30 seconds. The 18s RNA gene served as a housekeeping gene, and the commercially available normal brain [Takara Bio Inc. US] served as a calibrator. Relative quantification employed the 2-ΔΔCt method, presenting data as a fold change of gene expression.[8] Here, fold change less than 1 was considered as a downregulation of the gene, while values greater than 1 were considered as an upregulation of the gene.
| Gene | Forward primers | Reverse primers |
|---|---|---|
| Notch-1 | TGAATGGCGGGAAGTGTGAAG | GGTTGGGGTCCTGGCATCG |
| Notch-2 | GCCACTGTGTGCTGCCATAC | GGGAACAGGGAGCCAATACTG |
| Notch-3 | ATGGTATCTGCACCAACCTGG | GATGTCCTGATCGCAGGAAGG |
| Notch-4 | AACTCCTCCCCAGGAATCTG | CCTCCATCCAGCAGAGGTT |
| NPR-3 | CTAGGAGCTGGCTTGCTAAT | GGGTTCGCCTCTCAATGGTTAT |
| DLL1 | GATGTGATGAGCAGCATGGA | CCATGGAGACAGCCTGGATA |
| DLL3 | AATCGCCCTGAAGATGTAGACC | GCACCACCGAGCAAATACAA |
| 18s RNA | GGAGTATGGTTGCAAAGCTGA | ATCTGTCAATCCTGTCCGTGT |
RNA: Ribonucleic acid
Statistical analysis
Statistical analyses conducted in SPSS version 20.0 included a two-tailed chi-square [χ2] test for parameter relationships. Correlations with Notch-1 gene expression were evaluated using Spearman’s correlation coefficient [r]. Kaplan-Meier survival analysis evaluated PFS and OS. Multivariate survival analysis utilized the Cox Regression step-wise Forward LR model, with significance set at P ≤ 0.05.
RESULTS
Gene expression in MB patients
In the present study, we observed seven gene expressions using qPCR. In which we calculate relative gene quantification compared to the normal brain [Figure 1a] and calculate gene expression as fold change value [Figure 1b]. In fold change value <1 was considered as a downregulation of the gene, and > 1 was upregulation of the gene.
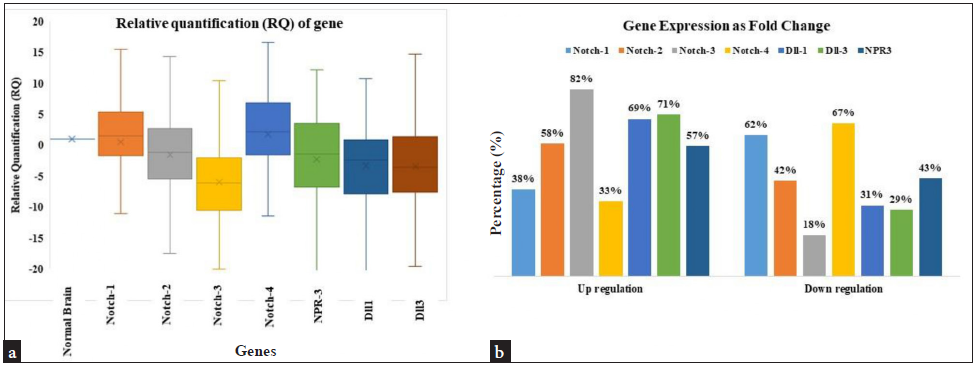
- Notch pathway gene expression, (a) The relative quantification value, normalized by the reference normal brain for seven genes, RNA is displayed as a log-transformed number. The upper and lower quartiles are shown by the top and bottom of the box, respectively. The median value for all samples is shown by the band in the center of the box. (b) Gene expression as Fold change.
In MB tissue, Notch-4 is slightly highly expressed compared to normal brain tissue, and Notch-1 is expressed the same as normal brain expression or all other genes have slight downregulation compared to normal brain in which Notch-3 has notably decreased expression.
Notch signaling pathway gene expression and clinicopathological parameter correlation
Gene expression of MB tumor as fold change value shows 38%, 58%, 82%, 33%, 69%, 71%, and 57% upregulation in Notch-1, Notch-2, Notch-3, Notch-4, DLL1, DLL3, and NPR3, respectively [Figure 1b].
Correlation between Notch-1 and Notch-2 gene expression and clinicopathological parameters shows no significant association with any parameters. Whereas Notch-3 correlation with clinicopathological parameters shows a significantly high correlation with the primary tumor site. Tumors at the occipital site have 100% [09/09] significant upregulation of the Notch-3 gene compared to other sites. [χ2=10.55, r=0.11, p=0.04] and correlation between Notch-4 gene expression and clinicopathological parameters shows a significant association with risk group and Notch-4 gene expression. Patients in the high-risk group show 38% upregulation than patients in the average-risk group [χ2=3.77, r=-0.19, p=0.05]. In ligand gene expression, a correlation between DLL3 gene expression and clinicopathological parameters showed a strong significant correlation between gender, risk group, and primary tumor site. Female patients showed 85% upregulation of the gene compared to male patients [χ2=4.59, r=-0.21, p=0.03], and patients in the high-risk group showed 76% upregulation of the DLL3 gene than average group patients [χ2=4.23, r=-0.20, p=0.04]. Patients with tumors located at the 4th ventricle region show 90% upregulation of the DLL3 gene than another tumor site [χ2=10.15, r=0.25, p=0.003]. Also, the correlation between NPR3 gene expression and clinicopathological parameters shows pediatric patients showed 63% upregulation than adults [χ2=6.18, r=-0.24, p=0.01] [Figure 2, Table 2].
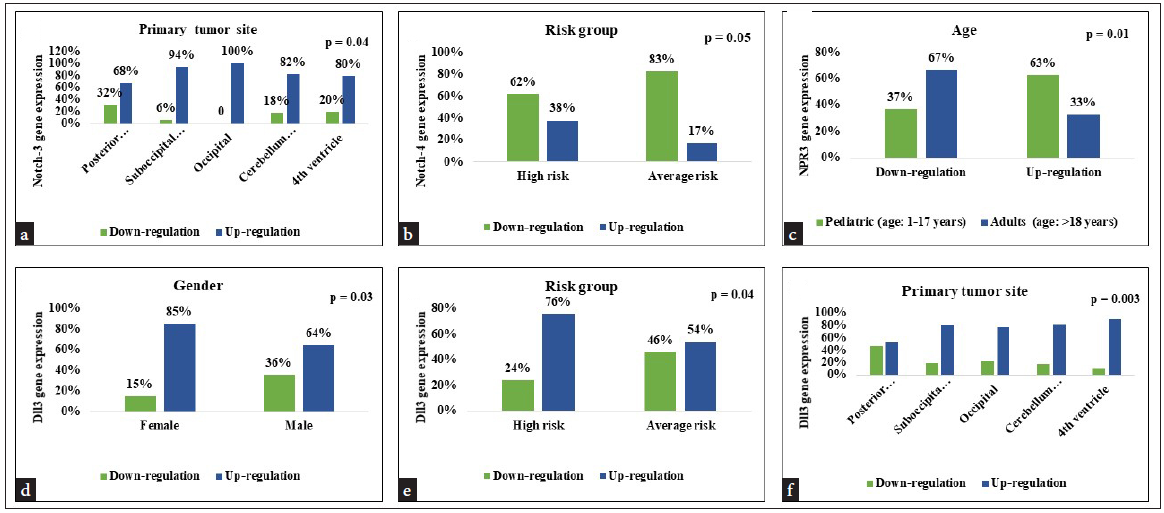
- Correlation between clinicopathological parameter and Notch signaling pathway gene (a) Correlation between tumor site and Notch-3 gene expression, (b) Correlation between risk group and Notch-4 gene expression (c) Correlation between age and NPR3 gene expression (d-f) Correlation between gender, risk group, tumor site and DLL3 gene expression.
| Parameters | N | Notch-1 gene expression | χ2 | r | P-value | |
|---|---|---|---|---|---|---|
| 103 | Down-regulation N = 64 | Up-regulation N = 39 | ||||
| Tumor type | ||||||
| Classical type | 78 | 52 (67) | 26 (33) | 7.62 | 0.17 | 0.08 |
| Nodular type | 13 | 07 (54) | 06 (46) | |||
| Desmoplastic type | 08 | 03 (37) | 05 (63) | |||
| Anaplastic | 02 | 02 (100) | 00 (00) | |||
| rhabdoid type | 02 | 00 (00) | 02 (100) | |||
| Parameters | Notch-3 gene expression | |||||
| Down-regulation N = 18 | Up-regulation N = 85 | |||||
| Primary tumor site | ||||||
| Posterior Fossa SOL | 38 | 12 (32) | 26 (68) | 10.5 | 0.11 | 0.04 |
| suboccipital region | 35 | 02 (06) | 33 (94) | |||
| Occipital | 09 | 00 (00) | 09 (100) | |||
| cerebellum region | 11 | 02 (18) | 09 (82) | |||
| 4th ventricle | 10 | 02 (20) | 08 (80) | |||
| Parameters | Notch-4 gene expression | |||||
| Down-regulation N = 69 | Up-regulation N = 34 | |||||
| Risk group | ||||||
| High | 79 | 49 (62) | 30 (38) | 3.77 | -0.19 | 0.05 |
| Average | 24 | 20 (83) | 04 (17) | |||
| Parameters | DLL1 gene expression | |||||
| Down-regulation N = 32 | Up-regulation N = 71 | |||||
| Gender | ||||||
| Female | 33 | 14 (42) | 19 (58) | 2.92 | 0.16 | 0.08 |
| Male | 70 | 18 (26) | 52 (74) | |||
| Parameters | DLL3 gene expression | |||||
| Down-regulation N = 30 | Up-regulation N = 73 | |||||
| Gender | ||||||
| Female | 33 | 05 (15) | 28 (85) | 4.59 | -0.21 | 0.03 |
| Male | 70 | 25 (36) | 45 (64) | |||
| Risk group | ||||||
| High | 79 | 19 (24) | 60 (76) | 4.23 | -0.20 | 0.04 |
| Average | 24 | 11 (46) | 13 (54) | |||
| Primary tumor site | ||||||
| Posterior fossa sol | 38 | 18 (47) | 20 (53) | 10.15 | 0.25 | 0.003 |
| Suboccipital region | 35 | 17 (20) | 28 (80) | |||
| Occipital | 09 | 02 (22) | 07 (78) | |||
| Cerebellum region | 11 | 02 (18) | 09 (82) | |||
| 4th ventricle | 10 | 01 (10) | 09 (90) | |||
| Parameters | NPR3 gene expression | |||||
| Down-regulation N = 44 | Up-regulation N = 59 | |||||
| Age | ||||||
| Pediatric (age: 1-17 years) | 82 | 30 (37) | 52 (63) | 6.18 | -0.24 | 0.01 |
| Adults (age: >18 years) | 21 | 14 (67) | 07 (33) | |||
Bold P values due to results are significant or nearly significant. SOL: Space occupying lesion
Inter gene correlation
To evaluate the correlation of the expression patterns among these 7 genes, we performed pairwise Spearman’s correlation tests. A strong correlation was detected among all genes and all genes show strong positive associations with each other. A significantly positive correlation was observed between the Notch-1 gene with Notch-2 [χ2=19.15, r = 0.53, p = 0.001], Notch-3 [χ2=10.15,r = 0.25, p = 0.01], Notch-4 [χ2=13.12, r = 0.43, p = 0.001], NPR3 [χ2=9.25, r = 0.35, p = 0.001], and DLL-1 [χ2 = 7.50, r = 0.26, p = 0.007]. Each receptor and ligand of the Notch signaling pathway showed inter correlations, demonstrating that from ligand to receptors, the pathway is connected and showed significance in MB tumor growth [Table 3].
| Genes | Notch1 | Notch2 | Notch3 | Notch4 | NPR3 | DLL1 | DLL3 |
|---|---|---|---|---|---|---|---|
| Notch1 | - |
r = 0.53 P = 0.001 |
r = 0.25 P = 0.01 |
r = 0.43 P = 0.001 |
r = 0.35 P = 0.001 |
r = 0.26 P = 0.007 |
r = 0.14 P = 0.13 |
| Notch2 | - | - |
r = 0.44 P = 0.001 |
r = 0.55 P = 0.001 |
r = 0.50 P = 0.001 |
r = 0.32 P = 0.001 |
r = 0.28 P = 0.004 |
| Notch3 | - | - | - |
r = 0.32 P = 0.001 |
r = 0.22 P = 0.02 |
r = 0.35 P = 0.001 |
r = 0.43 P = 0.001 |
| Notch4 | - | - | - | - |
r = 0.53 P = 0.001 |
r = 0.47 P = 0.001 |
r = 0.31 P = 0.001 |
| NPR3 | - | - | - | - | - |
r = 0.39 P = 0.001 |
r = 0.22 P = 0.02 |
| DLL1 | - | - | - | - | - | - |
r = 0.44 P = 0.001 |
| DLL3 | - | - | - | - | - | - | - |
Bold values are significant results. DLL: Delta like legand, NPR: Natriuretic peptide receptor
Univariate survival analysis in MB patients for PFS and OS using Kaplan-Meier analysis
In progression-free survival analysis, for both 12 and 24 months’ analysis, patients with an average risk group have a notable incidence of recurrence than high-risk group patients. That shows patients in the average risk group are more likely to have a recurrence [Log rank=40.26, p=<0.01] [Log rank=54.36, p=<0.01]. In 24 months of PFS analysis, Patients who receive only radiotherapy after surgery have no recurrence compared to patients who receive chemotherapy after surgery [Log rank=8.96, p=0.03]. There was no significance noted in any of the genes for 12 or 24 months of PFS analysis. Univariate survival analysis for 12 and 24-month OS demonstrated that patients who receive radiotherapy after surgery have a low incidence of death compared to patients receiving chemotherapy, chemotherapy, and radiotherapy, or only surgery for treatment [Log rank=12.74, p=0.005] [Log rank=8.73, p=0.03]. According to tumor location, patients with tumors located at the sub-occipital region of the brain show a high incidence of death compared to patients with other tumor locations [Log rank=9.01, p=0.06] [Table 4, Figure 3].
| Characteristics | N=103 | Progression-free survival | Overall survival | ||||||
|---|---|---|---|---|---|---|---|---|---|
| 12 months | 24 months | 12 months | 24 months | ||||||
| Disease relapsed | Log-rank p-value | Disease relapsed | Log-rank p-value | Patients died | Log-rank p-value | Patients died | Log-rank p-value | ||
| N (%) | N (%) | N (%) | N (%) | ||||||
| Age | NS | NS | NS | ||||||
| Pediatrics (age: 1-17 years) | 82 | 10 (12) | 12 (15) | 30 (37) | 33 (40) | 3.05 | |||
| Adults (age: >18 years) | 21 | 01 (05) | 01 (05) | 04 (19) | 04 (19) | 0.08 | |||
| Gender | NS | NS | NS | NS | |||||
| Female | 33 | 03 (09) | 03 (09) | 11 (33) | 11 (33) | ||||
| Male | 70 | 08 (11) | 10 (14) | 23 (33) | 26 (37) | ||||
| Tumor type | NS | NS | NS | NS | |||||
| Classical type | 78 | 07 (09) | 09 (12) | 29 (37) | 32 (41) | ||||
| Nodular type | 13 | 02 (15) | 02 (15) | 02 (16) | 02 (15) | ||||
| Desmoplastic type | 08 | 02 (25) | 02 (25) | 01 (13) | 01 (13) | ||||
| Anaplastic | 02 | 00 (00) | 00 (00) | 01 (50) | 01 (50) | ||||
| Rhabdoid type | 02 | 00 (00) | 00 (00) | 01 (50) | 01 (50) | ||||
| Risk group | NS | NS | |||||||
| High | 79 | 01 (01) | 40.26 | 01 (01) | 54.36 | 28 (35) | 31 (39) | ||
| Average | 24 | 10 (42) | <0.01 | 12 (50) | <0.01 | 06 (25) | 06 (25) | ||
| Treatment | |||||||||
| Surgery (S) | 49 | 02 (04) | 6.84 | 02 (04) | 8.96 | 24 (49) | 12.74 | 24 (49) | 8.73 |
| Surgery + CT | 04 | 01 (25) | 0.07 | 01 (25) | 0.03 | 00 (00) | 0.005 | 01 (25) | 0.03 |
| Surgery + RT | 06 | 00 (00) | 00 (00) | 01 (17) | 01 (17) | ||||
| S + RT + CT | 44 | 08 (18) | 10 (23) | 09 (20) | 11 (25) | ||||
| Primary tumor site | NS | NS | NS | ||||||
| Posterior fossa sol | 38 | 04 (11) | 05 (13) | 12 (32) | 12 (32) | 9.01 | |||
| Sub occipital region | 35 | 05 (14) | 05 (14) | 17 (49) | 19 (54) | 0.06 | |||
| Occipital | 09 | 00 (00) | 01 (11) | 01 (11) | 01 (11) | ||||
| Cerebellum region | 11 | 01 (09) | 01 (09) | 02 (18) | 02 (18) | ||||
| 4th ventricle | 10 | 01 (10) | 01 (10) | 02 (20) | 03 (30) | ||||
| Notch1 expression | NS | NS | NS | NS | |||||
| Down-regulated | 64 | 07 (11) | 09 (14) | 24 (38) | 26 (41) | ||||
| Up-regulated | 39 | 04 (10) | 04 (10) | 10 (26) | 12 (31) | ||||
| Notch2 expression | NS | NS | NS | NS | |||||
| Down-regulated | 43 | 04 (09) | 05 (12) | 17 (40) | 17 (40) | ||||
| Up-regulated | 60 | 07 (12) | 08 (13) | 17 (28) | 21 (35) | ||||
| Notch3 expression | NS | NS | NS | NS | |||||
| Down-regulated | 18 | 02 (11) | 02 (11) | 06 (33) | 06 (33) | ||||
| Up-regulated | 85 | 09 (11) | 11 (13) | 28 (33) | 32 (38) | ||||
| Notch4 expression | NS | NS | NS | NS | |||||
| Down-regulated | 69 | 08 (12) | 10 (14) | 23 (33) | 23 (33) | ||||
| Up-regulated | 34 | 03 (09) | 03 (09) | 11 (33) | 15 (44) | ||||
| DLL1 expression | NS | NS | NS | NS | |||||
| Down-regulated | 32 | 04 (13) | 05 (16) | 12 (38) | 12 (38) | ||||
| Up-regulated | 71 | 07 (10) | 08 (11) | 22 (31) | 26 (37) | ||||
| DLL3 expression | NS | NS | NS | NS | |||||
| Down-regulated | 30 | 05 (17) | 06 (20) | 12 (40) | 12 (40) | ||||
| Up-regulated | 73 | 06 (08) | 07 (10) | 22 (30) | 26 (36) | ||||
| NPR3 expression | NS | NS | NS | NS | |||||
| Down-regulated | 44 | 04 (09) | 05 (11) | 16 (37) | 16 (37) | ||||
| Up-regulated | 59 | 07 (12) | 08 (14) | 18 (31) | 22 (37) | ||||
NS: No significance, Bold values are significant results. RT: Radio therapy, CT: Chemo therapy
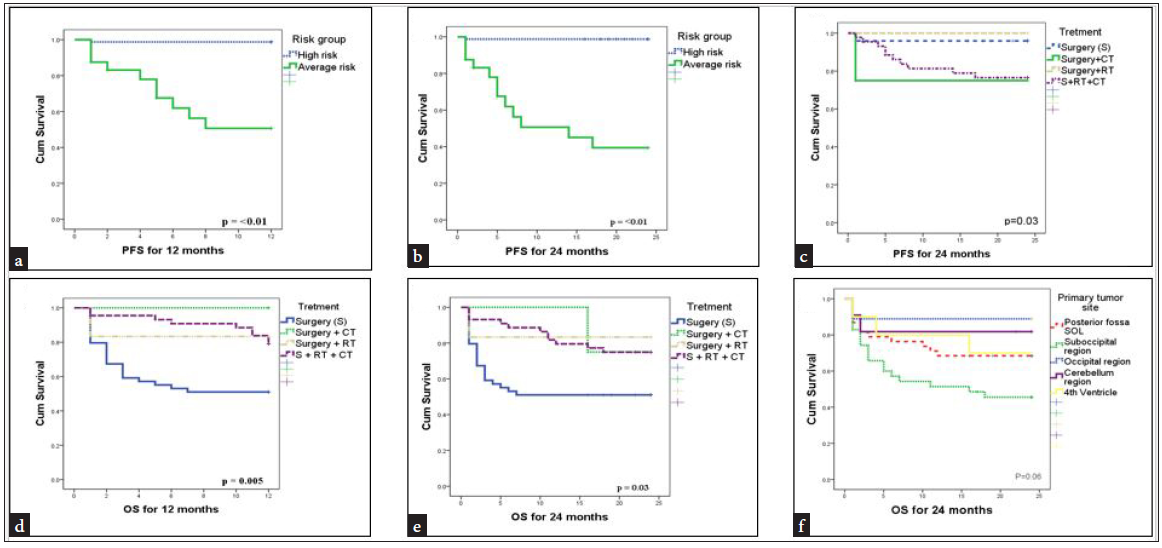
- Kaplan-Meier survival curves for 12 and 24 months PFS and OS (a) Patients risk group (12 months PFS), (b) Patients risk group (24 months PFS), (c) Treatment (24 months PFS) (d) Treatment (12 months OS) (e) Treatment (24 months OS), (f) Tumor site (24 months OS). PFS: Progression-free survival, OS: Overall survival
DISCUSSION
The observed upregulation of Notch pathway genes in MB tumors suggests their potential involvement in tumor progression. In MB, Notch-1 and Notch-2 have opposite biological effects. Notch-1 inhibits proliferation of MB, whereas Notch-2 promotes cell growth of MB. We found that expression of Notch-1 is not detectable, whereas Notch-2 is overexpressed in MB.[9] This observation is consistent with previous studies, such as those by Aburjania et al.,[10] which demonstrated that Notch-1 functions as a tumor suppressor in MB, while Notch-2 acts as an oncogene. The correlation between Notch pathway gene expression and clinicopathological parameters highlights the importance of considering molecular subtypes in MB patient stratification. Notably, the association of Notch-3 expression with the primary tumor site and Notch-4 expression with the risk group suggests their potential as prognostic markers.
Notch-3 upregulation has been observed in various cancers, including brain tumors like osteosarcoma, chondrosarcoma, and rhabdomyosarcoma, where it plays a role in embryonic brain tumor growth and glioma development. Notch-3 inhibition enhances the effectiveness of radiotherapy in brain tumors, and its dysregulation has been associated with tumor aggressiveness, maintenance, and resistance to chemotherapy. In osteosarcoma and chondrosarcoma, Notch-3 is upregulated, particularly in hypercellular areas of chondrosarcoma, suggesting a role in regulating stemness.[10] Similar findings were reported by Wang et al., who highlighted Notch-3’s role in enhancing glioma stem cell properties and radio-resistance. Notch-4 has been implicated in the development of breast cancer,[11,12] where it has been shown to be overexpressed in a subset of tumors. However, the mechanism by which Notch-4 is upregulated in high-risk patients with brain tumors has not been directly addressed in the results. It is possible that Notch-4 up-regulation in brain tumors is due to similar mechanisms as those observed in breast cancer, such as Mouse Mammary Tumor Virus (MMTV) integration into the Notch-4 locus or the activation of oncogenic signaling pathways. Further research, such as those conducted by Nagamatsu et al.[12] on breast cancer, is needed to determine the specific mechanisms by which Notch-4 is upregulated in brain tumors of high-risk group patients.
Furthermore, the gender-specific and age-specific differences in DLL3 and NPR3 expression underscore the need for personalized treatment approaches in MB patients. DLL3 is upregulated in female brain tumor patients, specifically in low-grade gliomas and proneural glioblastomas.[13] The NPR3 gene has been implicated in various cancers, including pediatric tumors. NPR3 has been reported to exert a tumor-suppressive effect in clear cell renal cell carcinoma and promote the proliferation and migration of triple-negative breast cancer [TNBC] cells and ER+ cells. However, the specific upregulation of the NPR3 gene in pediatric tumor patients is not directly addressed in the study.[14]
The analysis of progression-free survival [PFS] in patients with different risk groups and treatment modalities reveals important insights into recurrence and survival outcomes in cancer patients. The results indicate that patients in the average-risk group are more likely to experience recurrence compared to those in the high-risk group, as evidenced by the notable incidence of recurrence at both 12 and 24 months’ analysis [Log rank=40.26, p=<0.01] [Log rank=54.36, p=<0.01]. This aligns with the findings of LV et al.[14], who developed a clinical score for predicting recurrence in colon cancer patients, demonstrating that higher-risk patients had significantly shorter times to recurrence.
Furthermore, the impact of treatment modalities on recurrence is evident, particularly in the 24-month PFS analysis. Patients who received only radiotherapy after surgery had no recurrence compared to those who received chemotherapy after surgery [Log rank=8.96, p=0.03]. This underscores the significance of treatment selection in influencing recurrence outcomes and emphasizes the potential benefits of specific treatment approaches in preventing disease recurrence. Similar studies have shown that patients missing radiation therapy sessions had an increased risk of disease recurrence.[15] Interestingly, our study did not find any significant associations between gene expression patterns and PFS outcomes at 12 or 24 months. This suggests that factors beyond the analyzed genes may play a more substantial role in determining recurrence risk and survival outcomes, an observation also noted in other studies focusing on MB recurrence and survival.
In terms of OS analysis, the univariate survival analysis for 12 and 24-month OS revealed important findings related to treatment modalities. Patients who received radiotherapy after surgery demonstrated a lower incidence of death compared to those receiving chemotherapy, chemotherapy, and radiotherapy, or only surgery for treatment [Log rank=12.74, p=0.005] [Log rank=8.73, p=0.03]. This highlights the potential survival benefits associated with specific treatment sequences in cancer management. Studies on radiation therapy have found that mortality rates during radiation therapy are low, except in palliative care cases.[16] Additionally, research has indicated that acute pneumonitis and chemotherapy-related toxicity contribute to mortality in patients undergoing thoracic radiotherapy.[17]
Moreover, tumor location significantly impacted patient outcomes. Patients with tumors located in the suboccipital region of the brain showed a higher incidence of death compared to patients with tumors in other locations [Log rank=9.01, p=0.06]. This is consistent with findings that tumors in the suboccipital region can lead to severe complications such as increased intracranial pressure, resulting in neurological deficits and higher mortality rates.
Overall, our findings contribute to a better understanding of the molecular mechanisms underlying MB pathogenesis and may facilitate the development of targeted therapies for improved patient outcomes. This study underscores the complex interplay of risk factors, treatment modalities, and tumor characteristics in influencing recurrence and survival outcomes in cancer patients. Tailoring treatment strategies based on risk stratification, treatment modalities, and tumor characteristics can potentially improve patient outcomes and guide personalized cancer care.
Our study provides Notch pathway gene expression in MB, identifying potential prognostic markers and offering insights into treatment efficacy and recurrence. Additionally, survival analysis contributes valuable insights into treatment efficacy and recurrence patterns in MB patients, which is a strength of this study. However, it lacks functional validation which calls for further research.
CONCLUSION
This study highlights the clinical significance of Notch-3, Notch-4, DLL3, and NPR3 in medulloblastoma, demonstrating their potential as prognostic biomarkers. Notch-3 was significantly associated with tumor location, while Notch-4 and DLL3 were linked to high-risk patient stratification. Importantly, treatment outcomes varied based on post-surgical therapy. Patients who received only radiotherapy had significantly lower recurrence rates and improved survival compared to those receiving chemotherapy or combined therapy, underscoring the potential of radiotherapy in reducing early mortality. Additionally, the strong intercorrelation among Notch pathway components suggests a coordinated role in tumor progression. These findings emphasize the need for molecular profiling in treatment decisions and warrant further research to optimize therapy combinations, improving patient outcomes while minimizing treatment-related toxicity.
Acknowledgments
The current study was supported by the Gujarat Cancer Society and The Gujarat Cancer & Research Institute.
Author contribution
MM: Wrote the original manuscript, DT: Performed experiments, NB: Performed experiments, TT: Supervise the project and conceived the original idea.
Ethical approval
The research/study approved by the Institutional Ethics Committee at Gujarat Cancer and Research Institute, number EC/BHR/07/2020, dated 1st July 2020.
Declaration of patient consent
The authors certify that they have obtained all appropriate patient consent.
Financial support and sponsorship
Nil.
Conflicts of interest
There are no conflicts of interest.
Use of artificial intelligence (AI)-assisted technology for manuscript preparation
The authors confirm that there was no use of artificial intelligence (AI)-assisted technology for assisting in the writing or editing of the manuscript and no images were manipulated using AI.
REFERENCES
- The 2021 WHO classification of tumors of the central nervous system: A summary. Neuro-oncology. 2021;23:1231-51.
- [CrossRef] [PubMed] [PubMed Central] [Google Scholar]
- Cancer therapeutics: Targeting the dark side of myc. Eur J Cancer. 2005;41:2485-501.
- [CrossRef] [PubMed] [Google Scholar]
- Mortality during or shortly after curative-intent radio-[chemo-] therapy over the last decade at a large comprehensive cancer center. Clin Transl Radiat Oncol. 2023;41:100645.
- [CrossRef] [PubMed] [PubMed Central] [Google Scholar]
- SHH, WNT, and NOTCH pathways in medulloblastoma: When cancer stem cells maintain self-renewal and differentiation properties. Childs Nerv Syst. 2014;30:1165-72.
- [CrossRef] [PubMed] [Google Scholar]
- Notch signaling: Cell fate control and signal integration in development. Science. 1999;284:770-6.
- [CrossRef] [PubMed] [Google Scholar]
- Molecular risk stratification of medulloblastoma patients based on immunohistochemical analysis of MYC, LDHB, and CCNB1 expression. Clin Cancer Res. 2008;14:4154-60.
- [CrossRef] [PubMed] [Google Scholar]
- Prognostic significance of STAT3 gene expression in patients with glioblastoma tumors: A study from western India. J Egypt Natl Canc Inst. 2022;34
- [Google Scholar]
- Analysis of relative gene expression data using real-time quantitative PCR and the 2−ΔΔCT method. Methods. 2001;25:402-8.
- [CrossRef] [PubMed] [Google Scholar]
- Biological background of pediatric medulloblastoma and ependymoma: a review from a translational research perspective. Neuro-oncology. 2008;10:1040-60.
- [CrossRef] [PubMed] [PubMed Central] [Google Scholar]
- The role of Notch3 in cancer. Oncologist. 2018;23:900-11.
- [CrossRef] [PubMed] [PubMed Central] [Google Scholar]
- The association between Notch4 expression, and clinicopathological characteristics and clinical outcomes in patients with breast cancer. Oncol Lett. 2018;15:8749-55.
- [CrossRef] [PubMed] [PubMed Central] [Google Scholar]
- NOTCH4 is a potential therapeutic target for triple-negative breast cancer. Anticancer Res. 2014;34:69-80.
- [PubMed] [Google Scholar]
- Gene expression-based biomarkers designating glioblastomas resistant to multiple treatment strategies. Carcinogenesis. 2021;42:804-13.
- [CrossRef] [PubMed] [PubMed Central] [Google Scholar]
- A novel immune score model predicting the prognosis and immunotherapy response of breast cancer. Sci Rep. 2023;13:6403.
- [CrossRef] [PubMed] [PubMed Central] [Google Scholar]
- Missed radiation therapy sessions increase risk of cancer recurrence. WebMD; 2022 Dec 14. Available from: https://www.webmd.com/cancer/news/20221214/missed-radiation-therapy-sessions-increase-risk-cancer-recurrence [last accessed 27 Aug 2024]
- Notch1 and notch2 have opposite effects on embryonal brain tumor growth. Cancer Res. 2004;64:7787-93.
- [CrossRef] [PubMed] [Google Scholar]
- Mortality within 30 days of chemotherapy: A clinical governance benchmarking issue for oncology patients. Br J Cancer. 2006;95:1632-6.
- [CrossRef] [PubMed] [Google Scholar]