Aberrant Expression of PTPN-14 and Wilms’ Tumor 1 as Putative Biomarker for Locoregional Recurrence in Oral Squamous Cell Carcinoma
Address for correspondence Seema Nayak, MSc, PhD, Lab Medicine, Medanta Holding Pvt. Limited Lucknow, Shaheed Path, Lucknow 226030, Uttar Pradesh, India. seemagkp@gmail.com
This article was originally published by Thieme Medical and Scientific Publishers Pvt. Ltd. and was migrated to Scientific Scholar after the change of Publisher.
Abstract
Objective Locoregional recurrence in oral squamous cell carcinoma (OSCC) is a major concern that leads to metastasis. Its detection at earliest stage is very important to increase the overall survival of the patient. There is no any biomarker for locoregional recurrence in oral squamous cell carcinoma (OSCC). The aim of this study was to find a biomarker for locoregional recurrence in tissue and serum at gene and protein level.
Methods This work studied the expression of protein tyrosine phosphatase nonreceptor type 14 (PTPN-14) and Wilms’ tumor 1 (WT-1) in patients and correlated their expression with locoregional recurrence and survival. Tissue expression was observed in formalin fixed tissue biopsies of 96 OSCC and 32 healthy controls by immunohistochemistry using antibody against PTPN-14 and WT-1 and serum level was estimated by enzyme-linked immunosorbent assay in pre- and post-chemoradiotherapy samples. mRNA expression was determined by using real-time polymerase chain reaction. Patients were followed for 3 years for locoregional recurrence.
Results Expression of PTPN-14 and WT-1 in OSCC was upregulated (aberrant) in tissue and sera in both gene and protein level as compared with healthy controls. Locoregional recurrence was observed in 10 (23.80%) patients and significantly associated with PTPN-14 (p < 0.047) and WT-1 expression (p < 0.031).
Conclusion PTPN-14 and WT-1 may be used as biomarker to identify patients for higher risk of locoregional recurrence. This study drove molecular aspect and phenotypic level to derive new emergent strategies in future for recurrent OSCC.
Keywords
recurrence
OSCC
PTPN-14
WT-1
biomarker
immunohistochemistry

Introduction
Oral squamous cell carcinoma (OSCC) is highly diverse disease. The etiological factors of OSCC like tobacco, alcohol with smoking, and human papillomavirus infection are most prevalent with high chance of locoregional recurrence in OSCC patients. There is a wide gap in understanding the course of locoregional recurrence that leads to metastasis. It is major concerns in this disease to detect locoregional recurrences at earliest stage to increase the overall survival of the patient. The rate of locoregional recurrence in head and neck cancer is very high, near ∼25 to 45% and still there is no biomarker to detect high risk of locoregional recurrence after the course of treatment.1,2,3 Several clinical (grade, stage, nodal involvement) and genetic factors may play important role in local and distant locoregional recurrence. Many authors have studied molecular events involved in recurrence of OSCC but still the phenomenon remains elusive.4 Hence, the better understanding of the genetic alterations of this aggressive tumor will prospectively open the way for delivering novel treatments and help in patient’s management.4 There is not enough study on biomarker for locoregional recurrence. Ghantous et al4 studied CASP8 mutations can play an important role in tumor locoregional recurrence in OSCC patients. Serpa et al 5 studied urokinase-type plasminogen activator (uPA) and its receptor (uPAR) and suggested that uPA and uPAR are involved in the progression and aggressiveness of squamous cell carcinoma of tongue and uPAR was associated with the presence of locoregional recurrence. It is very urgent need to study biomarkers for early and locoregional recurrence. Many tumor suppressor genes have been studied; mechanisms of each tumor suppressor gene and its protein products are complex and interrelated to other cell signaling pathways.6,7
Protein tyrosine phosphatase nonreceptor type 14 (PTPN-14) is member of the protein tyrosine phosphatase family and is reportedly increased in many tumors, suggesting complex dysregulation in the balance of tyrosine phosphorylation. It is responsible for major modifications in cellular processes.8 Wang et al9 performed mutational analysis of the tyrosine phosphatase gene superfamily in human cancers, and 83 somatic mutations were identified in six protein-tyrosine phosphatases in which PTPN-14 is one of them. Several studies showed that PTPN-14 is mutated in breast, kidney, liver, ovarian, and skin cancers suggesting that PTPN-14 plays an important role in tumor genesis of multiple types of cancers10 including head and neck cancers. Wang et al9 implicated that PTPN-14 may act as a tumor suppressor gene. They suggest that in a portion of tumors one allele of PTPN-14 is mutated and the other allele is lost, consistent with a “two-hit” tumor suppressor model. Hence, they suggest it as tumor suppressor gene.
Inhuman umbilical vein endothelial cells PTPN-14 facilitates β-catenin dephosphorylation at adhesion junctions.11 Density-dependent nucleus-to-cytoplasm translocation of PTPN-14 was reported for cell proliferation12 and upregulation of PTPN-14 in MDCK cells led to the epithelial–mesenchymal transition.13 PTPN-14 also regulates transforming growth factor-β gene expression, thereby modulating epithelial-mesenchymal transition.13. Hence, PTPN-14 was found to have both tumor suppressive and promoting characteristics, so many are mentioned as ambiguous tumor suppressive phosphatase.14 Till date there is no study on expression of PTPN-14 in human OSCC.
Wilms’ tumor 1 (WT-1) protein is a tumor antigen for various kinds of cancer. WT-1 is associated with the uncontrolled epithelial-to-mesenchymal transition in several diseases and developmental abnormalities.15 WT-1 expression was studied in skin biopsy of endothelial proliferations and tumors.15 WT-1 expression is maintained during angiogenesis and malignant transformation of endothelial cells.
WT-1 can either suppress or induce the expression of genes. Contrary to its tumors suppressor role, its elevated levels have been pragmatic in leukemia and solid tumors. WT-1 has also acted as an oncogene by inducing the expression of MYC and BCL-2.16 Mikami et al17 suggested that WT-1 plays an important role in the pathogenesis of some types of OSCC, predominantly in proliferation of the cancer cells. WT-1 peptide-based cancer immunotherapy is widely anticipated as a new possibility for cancer treatment. Rather et al16 also suggested that WT-1 may be used as targeted therapeutic for cancer, including OSCC.
Hence, with the above background, both PTPN-14 and WT-1 have tumor suppressor role but may also have tumor promoting properties. We aim to find a biomarker for locoregional recurrence in tissue and sera at gene and protein level. We studied expression of PTPN-14 and WT-1 is OSCC patients in both tissue and serum and correlates its expression with locoregional recurrence, response to treatment and survival.
Materials and Methods
Subjects and Sample Collection
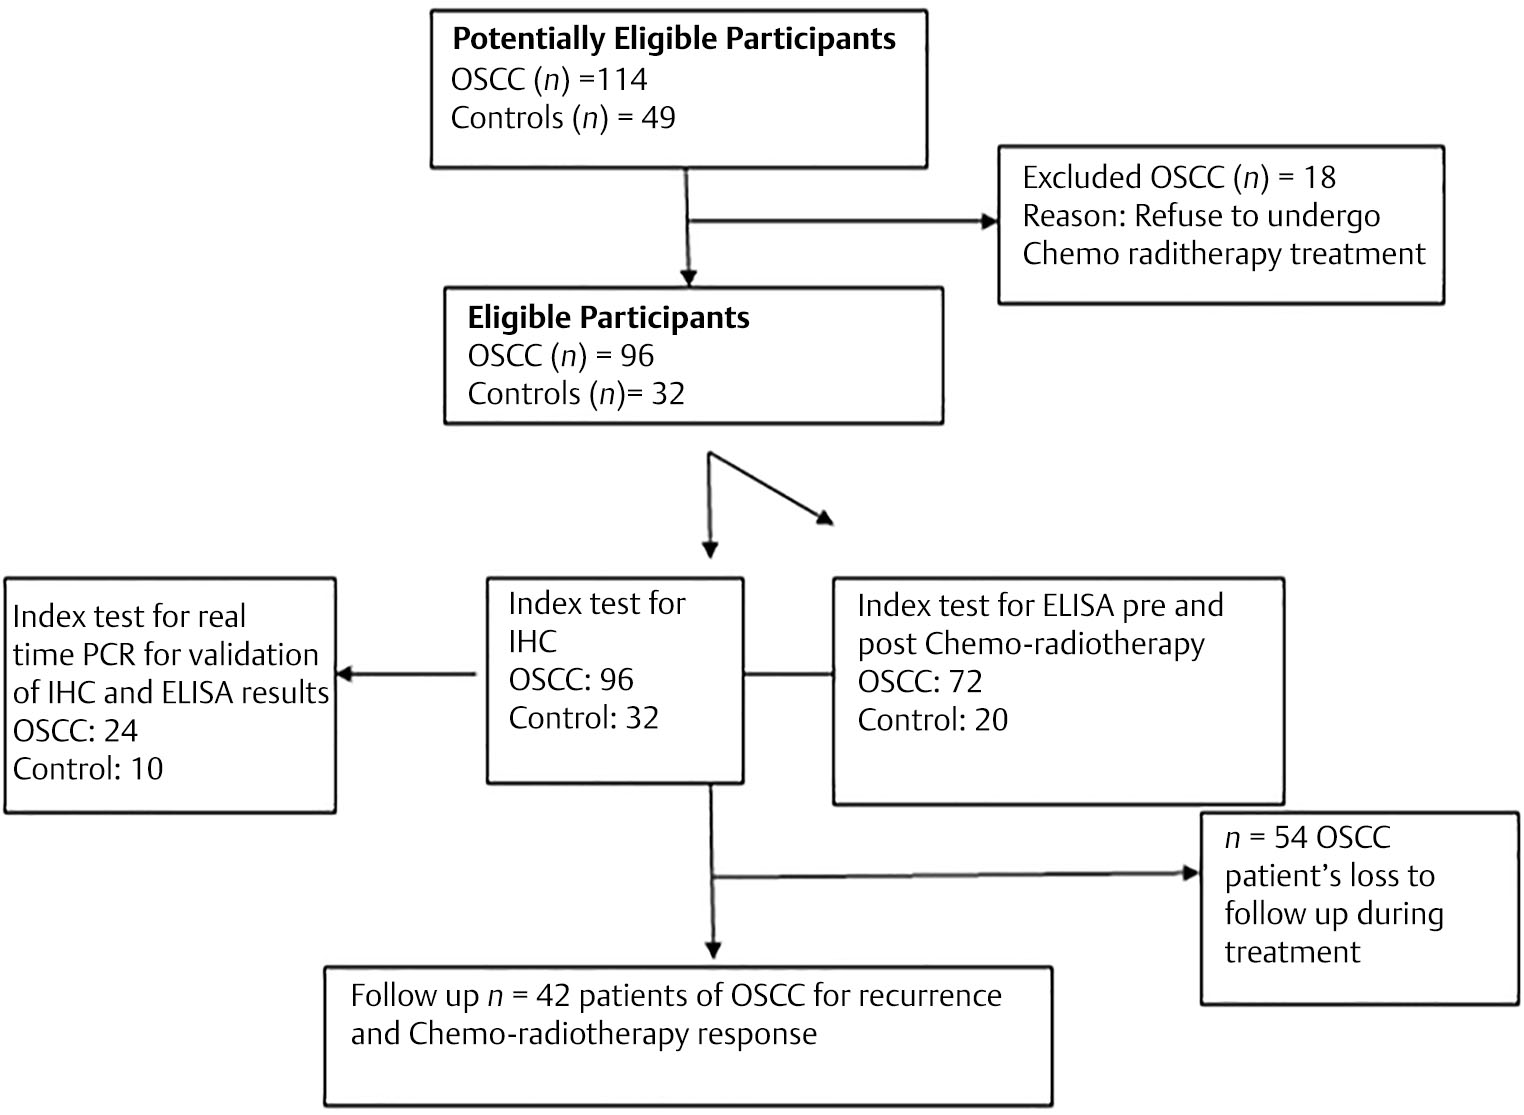
Total 96 OSCC and 32 healthy controls tissue biopsies were obtained from the Department of Oral and Maxillofacial Surgery and Department of Otorhinolaryngology, King George’s Medical University, Lucknow (Fig. 1), a tertiary care teaching hospital that represents the burden of OSCC patients in North Indian population. This study is the prospective case series study. Ethical approval from institutional ethics committee was taken before the commencement of study. It was obtained from King George’s Medical University, Lucknow, UP, India. Institutional ethical committee registration no. EcR/262/Inst/UP/2013 approved this study with reference code: 72nd ECM II-B Fellowship/P12 dated June 29, 2015. Written informed consent was taken from patients enrolled in this study. Patients of OSCC cases recruited from September 2015 to August 2017 for sample collection from Department of Oral and Maxillofacial Surgery and Department of Otorhinolaryngology undergoing for chemoradiotherapy treatment in Department of Radiotherapy, King George’s Medical University Lucknow and follow-up of these patients were noted till December 2018 from Department of Radiotherapy. The inclusion criterion of this study was that only biopsy proven cases of OSCC undergoing chemoradiotherapy treatment were taken after their consent. The samples were taken at the time of routine diagnostic examination. The patients suffering from any other malignancy in past or present or associated with any chronic debilitating disease were excluded from this study. Healthy oral tissues obtained from patients of Oral and Maxillofacial Surgery Department, undergoing cosmetic/dental surgery, who did not have any infective or inflammatory oral lesion, were taken as controls. Age and sex match healthy blood samples were taken from blood bank of the institute for enzyme-linked immunosorbent assay (ELISA) work. There is no selection bias in this study. All the experimental work of this study was done in Department of Pathology, King Georg’s Medical University, Lucknow.
-
Fig. 1 Flow diagram of participants in the study. ELISA, enzyme-linked immunosorbent assay; IHC, immunohistochemistry; OSCC, oral squamous cell carcinoma; PCR, polymerase chain reaction.
Clinical Assessment
A detailed predesigned structured proforma for obtaining clinical history including symptoms, age, sex, adverse oral habits like smoking or chewing of tobacco, alcohol consumption, duration of illness, clinical detail of the lesion, clinical staging, histological grading, course of treatment, outcome, and locoregional recurrence was filled for every patient. Stage of tumor was classified according to TNM staging as per 8th edition by American Joint Committee on Cancer system.
Patients enrolled in the year September 2015 to August 2017 were followed up to December 2018 to evaluate the treatment response, locoregional recurrence, and survivals (overall and disease free). In the first year, patients were followed up every 2 months and in the second and third year follow-up was after every 3 months. The median of follow-up time was 22 months. Overall survival was calculated from the date of histological identification of disease to the death of patient or final follow-up. Disease-free survival was also measured during the course of follow-up.
Chemoradiotherapy Assessment
The treatment plan of patient included two cycles of induction chemotherapy by taxol (175 mg/m2 on day 1) and cisplatin (50 mg/m2 on day 2) in Department of Radiotherapy, King George’s Medical University, Lucknow. Patients were given radiation along with concurrent cisplatin (35 mg/m2) for 4 weeks. Fractionated dose of 200 CGy/fraction to a total dose of 70 Gy was given in 35 fractions in 7 weeks, using external beam conventional method by Cobalt 60. The dose was delivered to primary tumors site and neck. If the calculated creatinine clearance level was in range of 30 to 50 mL/min, the dose of cisplatin was reduced to half and was discontinued if creatinine clearance level was less than 30 mL/min. When in patients the white blood count was less than 4000/mm3 or platelets count less than 100,000/mm, or there was persistent fever that exceeded 38°C or in presence of clinically apparent infections, the chemoradiation was postponed for 1 week or interrupted.
Synchronous chemotherapy in the form of injection cisplatin 30 mg/mL weekly was delivered with adequate hydration, antiemetic, and prophylaxis diuresis.
All the patients were assessed for treatment response after 1 month of completion of radiotherapy or chemoradiotherapy. The World Health Organization (WHO) criteria were followed to evaluate response in primary tumors namely complete disappearance of the tumor was categorized as complete response (CR), a reduction in more than 50% of tumor was defined as partial response (PR), and remaining patients with neither PR or CR were considered as nonresponder (NR). Collectively, CR and PR category patients were taken as responders and patients with progressive disease (PD) or stable disease (SD) were classified into NR as reported in our previously.18 Locoregional recurrence was also evaluated after the course of treatment.
Histopathological Examination
Biopsy tissues collected were processed for histopathological examination as per standard procedure. Briefly, 10% neutral buffered formalin was used to fix the tissue and 3 to 5 µm thick paraffin embedded sections were cut and put on coated slides. The sections on slides were stained with hematoxylin and eosin; thereafter, slides were reviewed by two pathologists independently and histological diagnosis was reported using WHO criteria. The pathological surgical margins were determined as negative if, microscopically, the distance between the resected tumor margins and the tumor cells was ≥ 5mm. Distance <5 mm is considered as positive tumor margins.
Immunohistochemistry
All the tissue sections fixed on the slides were first deparaffinized in xylene followed by gradient hydration using ethanol. For antigen retrieval, the sections on slide were heated for 15 minutes at 95°C in citrate buffer (pH 6.0) using an EZ antigen retriever system (BioGenex, United States). Endogenous peroxide activity in sections was neutralized using peroxidase block for 5 minutes. Thereafter, sections were washed in Tris buffer saline (TBS; pH 7.4) and put in protein block for 5 minutes and again washed two times in TBS. Then sections were incubated overnight at 4°C with primary antibodies against human PTPN-14 and WT-1 (Rabbit polyclonal, from Biorbyt Ltd. United Kingdom). Novolink polymer-based secondary kit was used to detect primary antibody bound in sections. Sections were washed thoroughly with TBS and treated with post-primary for 30 minutes at room temperature followed by incubation with Novolink polymer for 30 minutes at room temperature. After three washes with TBS, 3,3′-diaminobenzidine tetrahydrochloride substrate applied to the sections for 5 to 15 minutes in the dark. Then slides were counterstained with hematoxylin, dehydrated with ascending ethanol grades and xylene, and mounted permanently with DPX (dibutylphthalate polystyrene xylene). Negative control sections were processed by omitting primary antibody. Normal Kidney tissue was used as positive control for both PTPN-14 and WT-1 antibody.
Assessment of Immunohistochemical Staining
To assess the expression level of PTPN-14 and WT-1, semiquantitative scoring was done, calculating overall percentage area of the lesion stained positive (0–100%), and estimating the staining intensity (0–3). The expression of proteins in epithelium, endothelial cells, tumor cells along the invasion front and the tumor core and stroma were analyzed in all sections. The percentage positivity in area was graded as area less than 10% = 0, 10–25% = 1, 25–50% = 2, 50–75% = 3, and area more than 75% = 4. Grading of intensity of staining was as 0= none, 1 = mild, 2 = moderate, and 3 = strong staining. The percentage area scored (0–4) was multiplied by the intensity score (0–3) and to calculate a final score wherein 0–4 was considered negative staining and score of 5–12 as positive staining.18 Five best fields were taken for interpreting results of percentage area.
RNA Extraction and cDNA Synthesis
Frozen tissue samples were used to extract RNA using Trizol reagent (Invitrogen, Carlsbad, California, United States). DNase1 treatment (Thermo Scientific, Amplification grade) was performed to purify RNA free from DNA. Quality and quantity of RNA were assessed on Qubit 2.0 fluorometer (Molecular Probes, Invitrogen, Massachusetts, United States). About 250 ng of the purified RNA was used to generate cDNA by reverse transcription with Revert Aid First Strand cDNA synthesis kit (Thermo Scientific), using random hexamer primers as per the detailed instructions. In short, 20 µL reaction was performed in three steps. Step 1 at 25°C for 5 minutes, step 2 at 42°C for 1 hours, and finally step 3 at 70°C for 5 minutes. After synthesis, cDNAs were stored at -20°C for further analysis.
Real-Time PCR forPTPN-14 and WT-1
Semiquantitative real-time polymerase chain reaction (PCR) with SYBR Green fluorescent dye was performed on StepOne real-time PCR system (Applied Biosystems, United States), to quantify the transcripts of PTPN-14 and WT-1. Each 20 µL PCR reaction contained 10 µL of 2X SYBR Green master mix with dNTPs, ROX dye; 0.5 µM of each forward and reverse primers and synthesized cDNA. PCR primers for PTPN-14 [19] and WT-1 [17] were chosen from a published article and synthesized by Eurofins Genomics India Pvt Ltd. Primers sequences are as follows were used: β-actin (endogenous control): forward 5′-GAGACCTTCAACACCCCAGCC-3′; reverse 5′-AGACGCAGGATGGCATGGG-3′, PTPN-14: forward 5′-CATGACGCTCAAGTCG -3′; reverse 5′- GGACCGGGGTACTC-3′ WT-1 forward 5′-AGGGTACGAGCGATAACCACAC-3′, reverse 5′-TCAGATGCCGACCGTACAAGA-3′. The PCR reaction mixture (20 µL) prepared was dispensed into a fast optical 48-well real-time PCR reaction plate (Applied Biosystems, United States). Thermal profile used was as follows; initial denaturation at 95°C for 10 minutes followed by 40 cycles of 15 seconds at 95°C and 60 seconds at 60°C and thereafter thermal dissociation (melt curve) analysis was performed. To quantify relative gene expression, the delta delta (2-ΔΔCt) method was applied, with β-actin as an endogenous control and changes in gene expression were reported as fold change. A negative control without a template was run in parallel to assess the overall specificity of the reaction. The reactions were run in replicates.
ELISA for PTPN-14 and WT-1
Serum from 72 pre- and post-chemoradiotherapy samples and 20 healthy controls was analyzed by ELISA. ELISA kits for PTPN-14 and WT-1 were procured from Chongqing Biospes Co., Ltd and the expressed protein was analyzed in each case as per instructions from the manufacturer.
Statistical Analysis
Statistical analysis was done using version 23.0 SPSS software for windows (SPSS, Inc., Chicago, Illinois, United States). For evaluating proportional data, chi-squared test was performed. The continuous variables were compared using Student’s t-test. Kaplan–Meier method and the log-rank test were used to do survival analysis and plotting of survival curves. Univariate analysis of survival was performed by Kaplan–Meier method and multivariate analyses were measured by Cox proportional hazards model in a stepwise manner. For all the tests, a p < 0.05 was considered as statistically significant.
Results
Patient Clinical Data
This study includes 96 patients of OSCC and 32 healthy controls. The mean ±SD of age of all patients was 43.38 ± 15.61 years and ranged from 20 to 84 years with median age 50 years. Most prominent site was tongue (43%). Lymph node was present in 69.79% cases. Stages I to II cases were 46.87% and stages III to IV were 53.13% as shown in Table 1
|
Clinical characteristics |
Frequency (n) |
Percentage (%) |
|---|---|---|
|
Age |
||
|
<50 |
52 |
54.17% |
|
>50 |
44 |
45.83% |
|
Gender |
||
|
Male |
78 |
81.25% |
|
Female |
18 |
18.75% |
|
Topological site |
||
|
Buccal mucosa |
20 |
20.83 |
|
Tongue |
42 |
43.75 |
|
Palate |
7 |
7.29 |
|
Gingivobuccal sulcus |
8 |
8.33 |
|
Tonsil |
7 |
7.29 |
|
Lip |
4 |
4.17 |
|
Floor of mouth |
1 |
1.04 |
|
Retromolar region |
5 |
5.22 |
|
Mandible |
1 |
1.04 |
|
Submandibular gland |
1 |
1.04 |
|
Differentiation |
||
|
WD |
48 |
50 |
|
MD |
28 |
29.17 |
|
PD |
20 |
20.83 |
|
Tumor stage |
||
|
Stage I–II |
45 |
46.87 |
|
Stage III–IV |
51 |
53.13 |
|
Node involvement |
||
|
Present |
67 |
69.79 |
|
Absent |
29 |
30.21 |
|
Tobacco chewing habit |
||
|
Present |
69 |
71.87 |
|
Absent |
27 |
28.1 |
|
Alcohol |
||
|
Present |
43 |
44.79 |
|
Absent |
53 |
55.21 |
|
Smoking |
||
|
Present |
57 |
59.37 |
|
Absent |
39 |
40.63 |
|
Tobacco+ alcohol |
||
|
Present |
34 |
35.42 |
|
Absent |
62 |
64.58 |
|
Tobacco+ smoke |
||
|
Present |
37 |
38.54 |
|
Absent |
59 |
61.46 |
|
Alcohol+ smoke |
||
|
Present |
34 |
35.41 |
|
Absent |
62 |
64.58 |
|
Tobacco+ alcohol+ smoke |
||
|
Present |
27 |
28.12 |
|
Absent |
69 |
71.88 |
|
Response to therapy (n = 42) |
||
|
No |
17 |
40.48 |
|
Partial |
15 |
35.71 |
|
Complete |
10 |
23.81 |
|
Locoregional recurrence |
||
|
Present |
10 |
23.81 |
|
Absent |
32 |
76.19 |
Abbreviations: MD, moderately differentiated; OSCC, oral squamous cell carcinoma; PD, poorly differentiated; WD, well differentiated.
Immunohistochemical Expression of PTPN-14 and WT-1 in OSCC and Controls
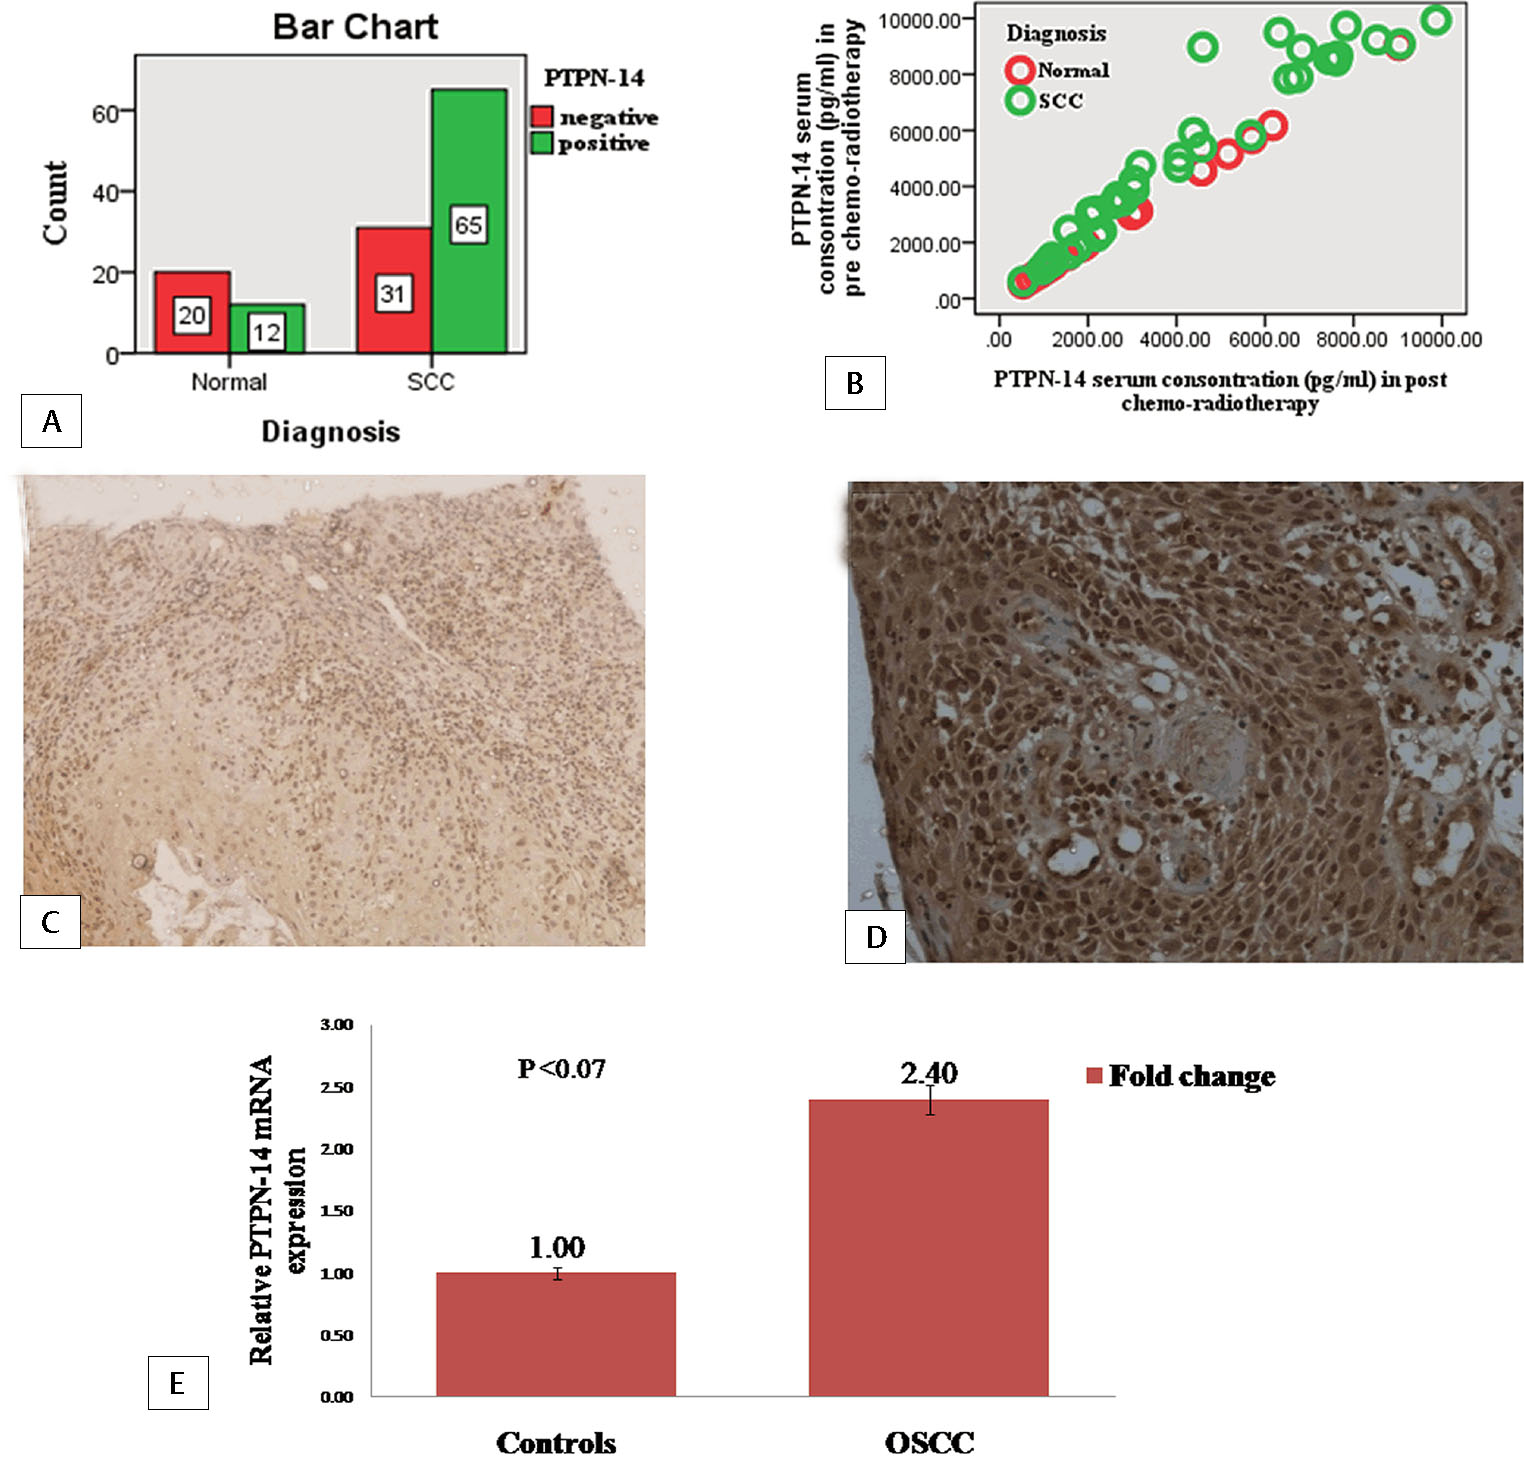
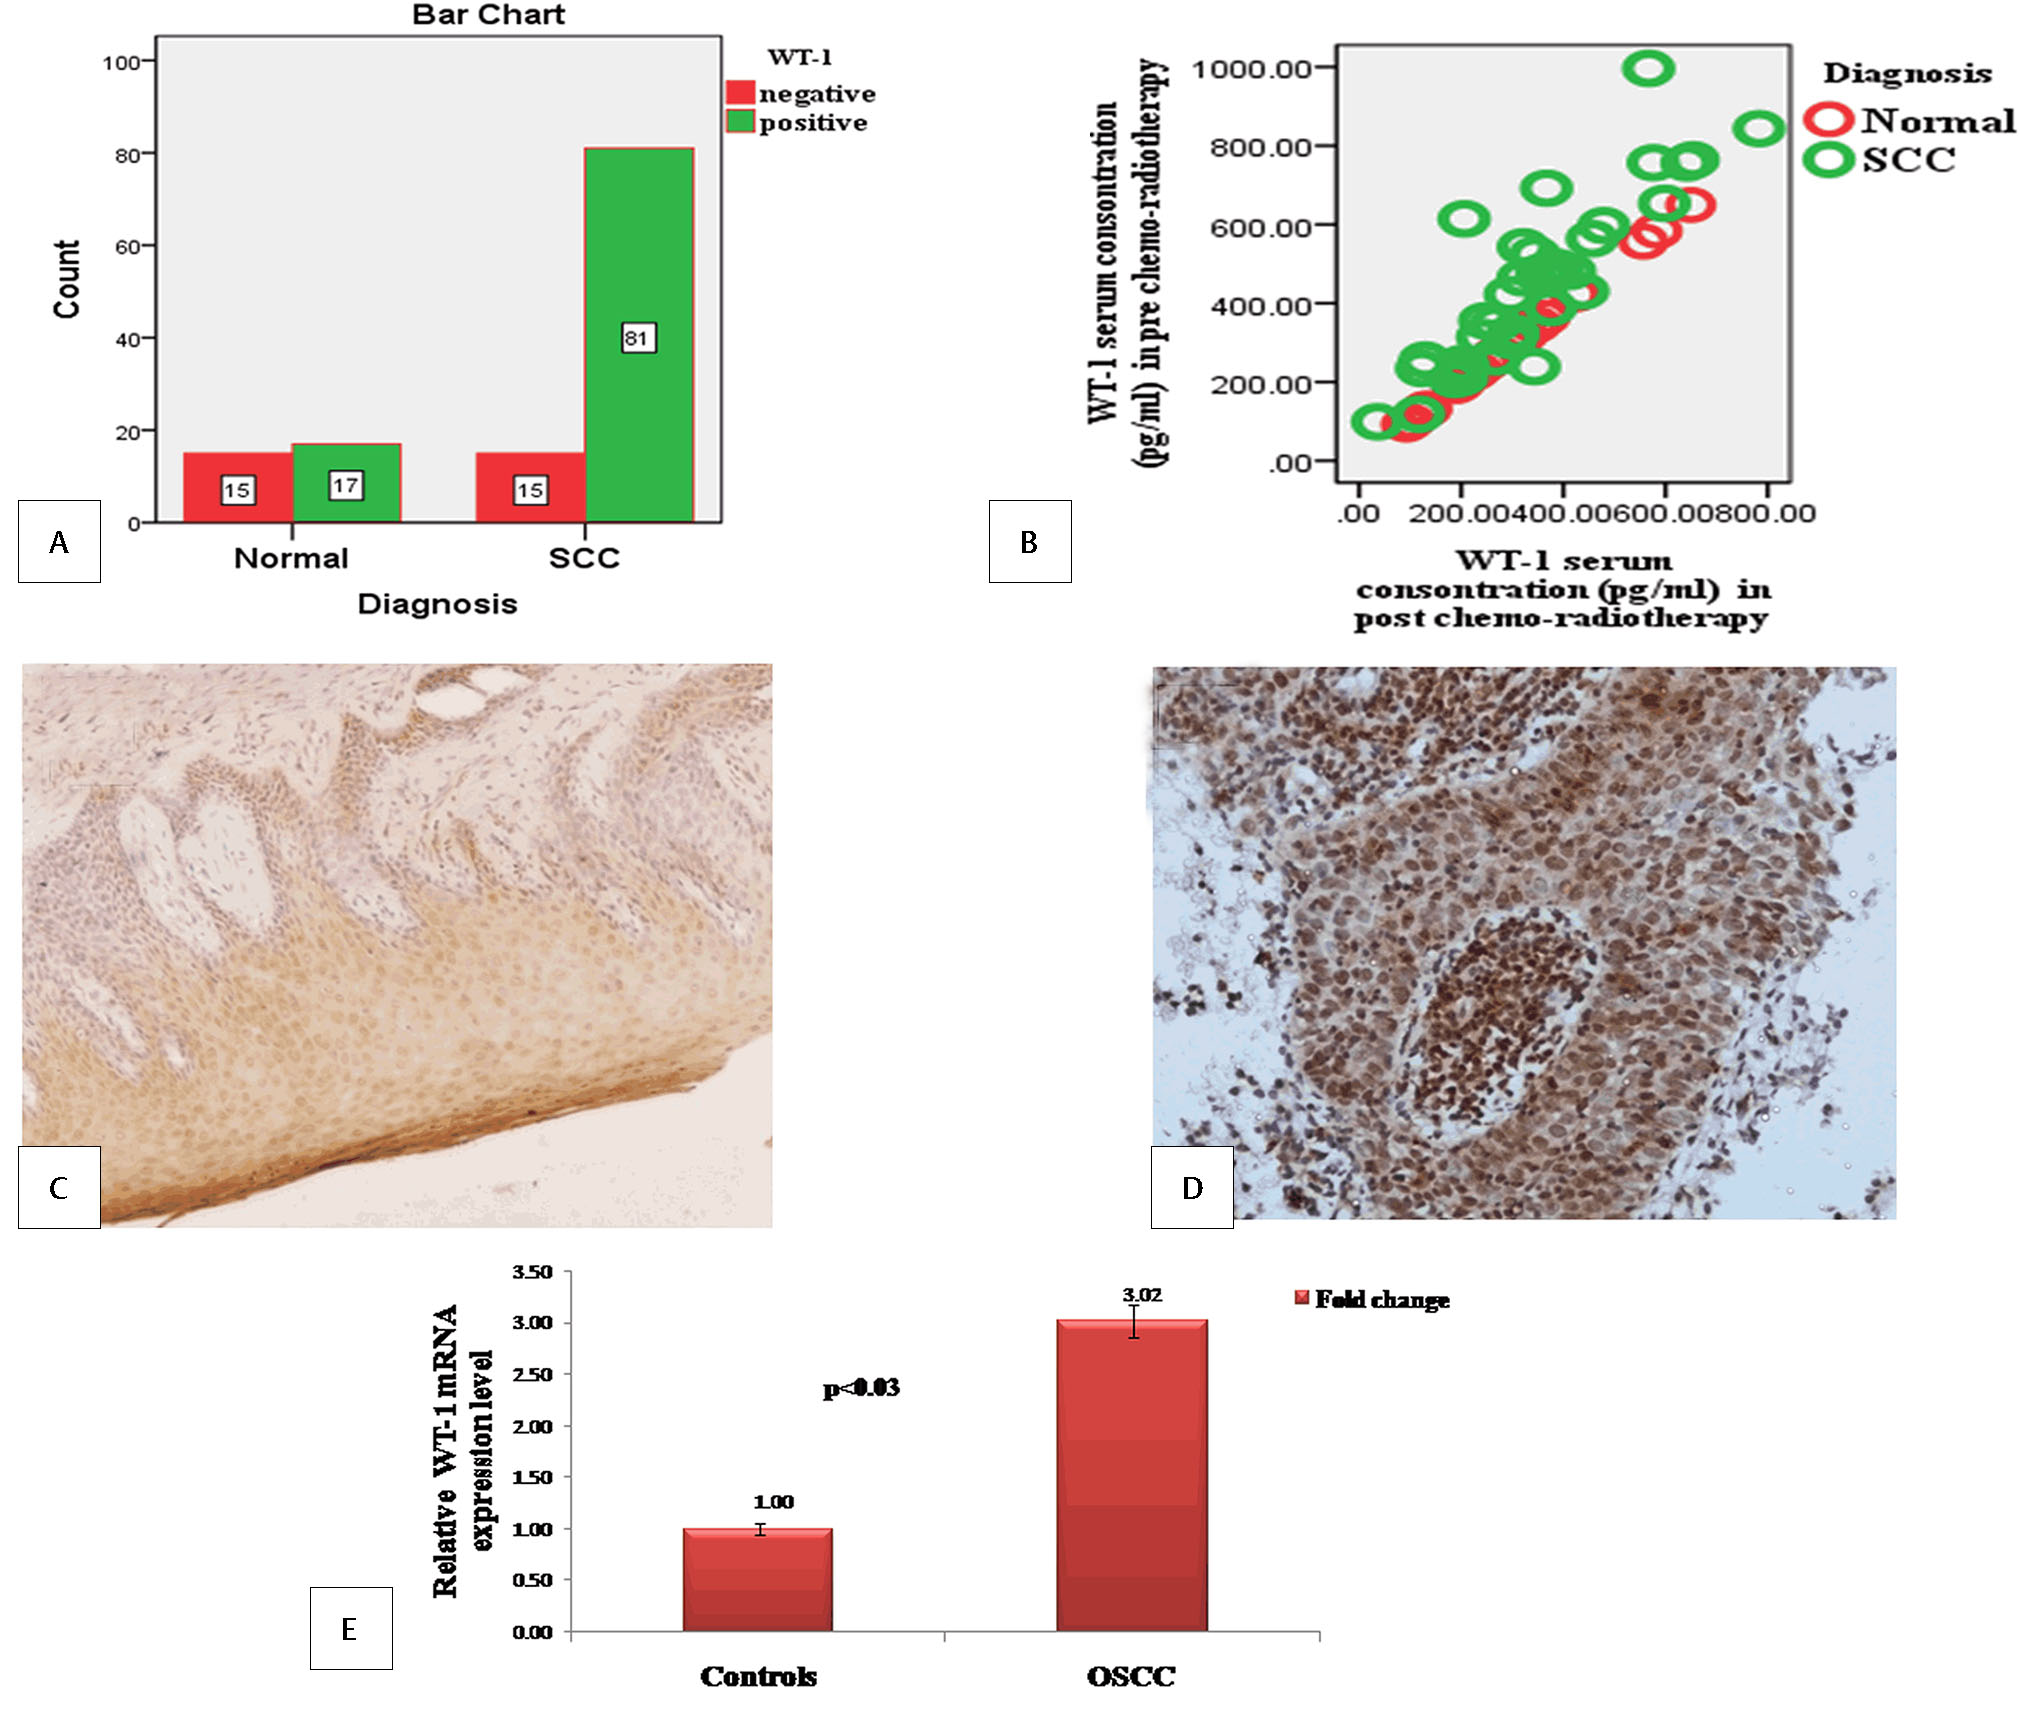
PTPN-14 and WT-1 expression was observed in 96 OSCC cases and 32 healthy controls. PTPN-14 expression was positive in 65 (67.70%) cases in OSCC and 12 (37.5%) in controls as shown in Fig. 2A. It was cytoplasmic and nuclear staining including carcinoma/invasion front and stromal cells (Fig. 2C and D). WT-1 expression was found in 81 (84.37%) cases of OSCC and 17 (53.12%) healthy controls as shown in the bar diagram as shown in Fig. 3A. It was cytoplasmic and nuclear staining expressed in basal layer of the infiltrating cancer nests (Fig. 3C and D).
-
Fig. 2 Protein tyrosine phosphatase nonreceptor type 14 (PTPN-14) expression in cases and controls.(A) Bar diagram for immunohistochemical expression of PTPN-14 in oral squamous cell carcinoma (OSCC) and controls (bar denotes the number of samples). (B) Scatter plot for PTPN-14 serum concentration in pre- and post-chemoradiotherapy OSCC and controls. (C) Immunohistochemical expression of PTPN-14 in control X10. (D) Immunohistochemical expression of PTPN-14 in tumor cells of OSCC X20. (E) Bar diagram for fold change expression of PTPN-14 gene by real-time polymerase chain reaction in OSCC with respect to control (bar represents the fold change of PTPN-14).
-
Fig. 3 Wilms’ tumor 1 (WT-1) expression in cases and controls.(A) Bar diagram for immunohistochemical expression of WT-1 in oral squamous cell carcinoma (OSCC) and controls (bar denotes the number of samples). (B) Scatter plot for WT-1 serum concentration in pre- and post-chemoradiotherapy OSCC and controls. (C) Immunohistochemical expression of WT-1 in control X10. (D) Immunohistochemical expression of WT-1 in tumor cells of OSCC X20. (E) Bar diagram for fold change expression of WT-1 gene by real-time polymerase chain reaction in OSCC with respect to control (bar represents the fold change of WT-1).
Association of Immunohistochemical Expression of PTPN-14 and WT-1 with Clinicopathological Parameters
There was no significant association of expression of PTPN-14 and WT-1 with sex, adverse oral habit (tobacco, alcohol and smoking), lymph node metastasis, tumor stage and differentiation, response to treatment as shown in Table 2. PTPN-14 (p < 0.047) and WT-1 (p < 0.031) were significantly associated with locoregional recurrence in OSCC.
|
Variables |
PTPN-14 positive |
PTPN-14 negative |
χ2a |
p-Value |
WT-1 positive |
WT-1 negative |
χ2 |
p-Value |
|---|---|---|---|---|---|---|---|---|
|
Control |
12 |
20 |
9.137 |
0.003 |
17 |
15 |
13.06 |
0.000 |
|
Cases |
65 |
31 |
81 |
15 |
||||
|
Age |
||||||||
|
<50 |
39 |
13 |
2.75 |
0.260 |
42 |
10 |
1.11 |
0.290 |
|
≥50 |
26 |
18 |
49 |
5 |
||||
|
Sex |
||||||||
|
Male |
49 |
29 |
4.54 |
0.033 |
65 |
13 |
0.342 |
0.558 |
|
Female |
16 |
2 |
16 |
2 |
||||
|
Lymph node involvement |
||||||||
|
Present |
49 |
18 |
2.98 |
0.084 |
54 |
13 |
2.40 |
0.121 |
|
Absent |
16 |
13 |
27 |
2 |
||||
|
Tumor stage |
||||||||
|
Stage I–II |
31 |
14 |
0.054 |
0.816 |
38 |
7 |
0.000 |
0.986 |
|
Stage III–IV |
34 |
17 |
43 |
8 |
||||
|
Tumor differentiation |
||||||||
|
WD |
29 |
19 |
3.90 |
0.142 |
42 |
6 |
5.62 |
0.060 |
|
MD |
23 |
5 |
20 |
8 |
||||
|
PD |
13 |
7 |
19 |
1 |
||||
|
Tobacco chewing habit |
||||||||
|
Present |
46 |
23 |
0.122 |
0.727 |
59 |
10 |
0.239 |
0.625 |
|
Absent |
19 |
8 |
22 |
5 |
||||
|
Alcohol |
||||||||
|
Present |
31 |
12 |
0.685 |
0.408 |
36 |
7 |
0.025 |
0.874 |
|
Absent |
34 |
19 |
45 |
8 |
||||
|
Smoking |
||||||||
|
Present |
37 |
20 |
0.502 |
0.479 |
49 |
8 |
0.269 |
0.604 |
|
Absent |
28 |
11 |
32 |
7 |
||||
|
Tobacco+ alcohol |
||||||||
|
Present |
23 |
11 |
0.000 |
0.992 |
27 |
7 |
0.984 |
0.321 |
|
Absent |
42 |
20 |
54 |
8 |
||||
|
Tobacco+ smoke |
||||||||
|
Present |
24 |
13 |
0.223 |
0.637 |
31 |
6 |
0.016 |
0.899 |
|
Absent |
41 |
18 |
50 |
9 |
||||
|
Alcohol+ smoke |
||||||||
|
Present |
24 |
10 |
0.200 |
0.655 |
29 |
5 |
0.034 |
0.854 |
|
Absent |
41 |
21 |
52 |
10 |
||||
|
Tobacco+ alcohol+ smoke |
||||||||
|
Present |
19 |
8 |
0.122 |
0.727 |
23 |
4 |
0.019 |
0.891 |
|
Absent |
46 |
23 |
58 |
11 |
||||
|
Response to therapy |
||||||||
|
No |
14 |
3 |
1.63 |
0.443 |
13 |
4 |
1.34 |
0.510 |
|
Partial |
11 |
4 |
12 |
3 |
||||
|
Complete |
6 |
4 |
6 |
4 |
||||
|
Locoregional recurrence |
||||||||
|
Present |
8 |
2 |
0.047 |
0.754 |
10 |
0 |
4.65 |
0.031 |
|
Absent |
23 |
9 |
21 |
11 |
Abbreviations: PTPN-14, protein tyrosine phosphatase nonreceptor type 14; WT-1, Wilms’ tumor 1.
aχ2 = chi-squared value.
ELISA for Serum PTPN-14 and WT-1 in OSCC and Controls
Mean serum levels of PTPN-14 and WT-1 in pre- and post-chemoradiotherapy samples and controls were shown in Table 3. PTPN-14 and WT-1 mean serum concentration was higher in OSCC as compared with controls in both pre- and post-chemoradiotherapy samples (Figs. 2B and 3B).
|
Samples |
Mean serum concentration in controls (pg/mL) |
Mean serum concentration in cases (pg/mL) |
Levene’s test for equality of variance between two variables |
Df |
p-Value |
|---|---|---|---|---|---|
|
PTPN-14 |
|||||
|
Pre-chemoradiotherapy samples |
2897.29 ± 2291.69 |
4429.14 ± 2836.49 |
OSCC/controls (n = 72/20) |
90 |
0.085 |
|
Post-chemoradiotherapy samples |
3711.56 ± 2459.11 |
OSCC/controls (n = 72/20) |
56 |
0.187 |
|
|
WT-1 |
|||||
|
Pre chemoradiotherapy Samples |
299.52 ± 157.23 |
443.91 ± 230.30 |
OSCC/controls (n = 72/20) |
90 |
0.049 |
|
Post-chemoradiotherapy samples |
338.25 ±195.10 |
OSCC/controls (n = 72/20) |
56 |
0.417 |
Abbreviations: Df, degree of freedom; ELISA, enzyme-linked immunosorbent assay; OSCC, oral squamous cell carcinoma; PTPN-14, protein tyrosine phosphatase nonreceptor type 14; WT-1, Wilms’ tumor 1.
Quantitative Real-Time PCR for PTPN-14 and WT-1 Expression
Relative gene expression of PTPN-14 was higher (2.40-fold) in cases than healthy controls and the difference was statistically insignificant (p < 0.07) as shown in Fig. 2E. It was observed that gene expression of WT-1 was also higher (3.02-fold) compared with healthy controls and the difference was statistically significant (p < 0.03; Fig. 3E).
Association of PTPN-14 and WT-1 with Chemoradiotherapy Treatment and Locoregional Recurrence
From a total of 96 patients of OSCC, only for 42 patients who underwent chemoradiotherapy treatment was successfully followed up. Fifteen patients who underwent surgery, and thirty-nine patients were dropouts during the course of follow-up, were excluded from the analysis. Out of remaining 42 patients, 17 were NR, 15 were PR, and 10 patients were CR. Hence, 25 patients were included as responders and 17 as nonresponders. PTPN-14 (p < 0.443) and WT-1 (p < 0.510) were not associated with response to treatment. Locoregional recurrence was observed in 10 (23.80%) patients. Tongue is most prominent site for locoregional recurrence (40%). Locoregional recurrence was significantly associated with PTPN-14 (p < 0.047), WT-1 expression (p < 0.031), and tumor margins (p < 0.041) as shown in Table 4.
|
Variables |
Recurrence |
Nonrecurrence |
p-Value |
|---|---|---|---|
|
Age |
|||
|
Mean ± SD |
|||
|
Range |
41–64 |
29–84 |
|
|
Length of follow- up (mo) |
|||
|
Mean ± SD |
25.48 ± 5.77 |
23.25 ± 6.57 |
|
|
Median |
25 |
23.5 |
|
|
Range |
4–31 |
6–37 |
|
|
Sex |
|||
|
Male |
8 |
27 |
0.746 |
|
Female |
2 |
5 |
|
|
Lymph node metastasis |
|||
|
Present |
6 |
25 |
0.255 |
|
Absent |
4 |
7 |
|
|
Tumor stage |
|||
|
Stage I–II |
7 |
16 |
0.267 |
|
Stage III–IV |
3 |
16 |
|
|
Tumor differentiation |
|||
|
WD |
5 |
15 |
0.763 |
|
MD |
3 |
13 |
|
|
PD |
2 |
4 |
|
|
Tobacco chewing habit |
|||
|
Present |
7 |
22 |
0.941 |
|
Absent |
3 |
10 |
|
|
Alcohol |
|||
|
Present |
6 |
13 |
0.283 |
|
Absent |
4 |
19 |
|
|
Smoking |
|||
|
Present |
6 |
22 |
0.608 |
|
Absent |
4 |
10 |
|
|
Tobacco+ alcohol |
|||
|
Present |
4 |
11 |
0.746 |
|
Absent |
6 |
21 |
|
|
Tobacco+ smoke |
|||
|
Present |
2 |
15 |
0.131 |
|
Absent |
8 |
17 |
|
|
Alcohol+ smoke |
|||
|
Present |
3 |
12 |
0.666 |
|
Absent |
7 |
20 |
|
|
Tobacco+ alcohol+ smoke |
|||
|
Present |
3 |
9 |
0.909 |
|
Absent |
7 |
23 |
|
|
Response to treatment |
|||
|
Responder |
6 |
19 |
0.972 |
|
Non responder |
4 |
13 |
|
|
Number of overall survival |
|||
|
Yes |
6 |
18 |
0.834 |
|
No |
4 |
14 |
|
|
PTPN-14 expression |
|||
|
Positive |
8 |
23 |
0.047 |
|
Negative |
2 |
9 |
|
|
WT-1 expression |
|||
|
Positive |
10 |
21 |
0.031 |
|
Negative |
0 |
11 |
|
|
Tumor margins |
|||
|
Positive |
6 |
8 |
0.041 |
|
Negative |
4 |
24 |
|
|
Disease-free survival (mo) |
|||
|
Mean ± SD |
17.9 ± 8.5 |
21.8 ± 6.7 |
|
|
Median |
17.5 |
21.5 |
|
|
Overall survival (mo) |
|||
|
Mean ± SD |
21.40 ± 7.31 |
23.25 ± 6.57 |
|
|
Median |
19.5 |
23.5 |
Abbreviations: MD, moderately differentiated; PD, poorly differentiated; PTPN-14, protein tyrosine phosphatase nonreceptor type 14; SD, standard deviation; WD, well differentiated; WT-1, Wilms’ tumor 1.
Survival Analysis in OSCC Patients
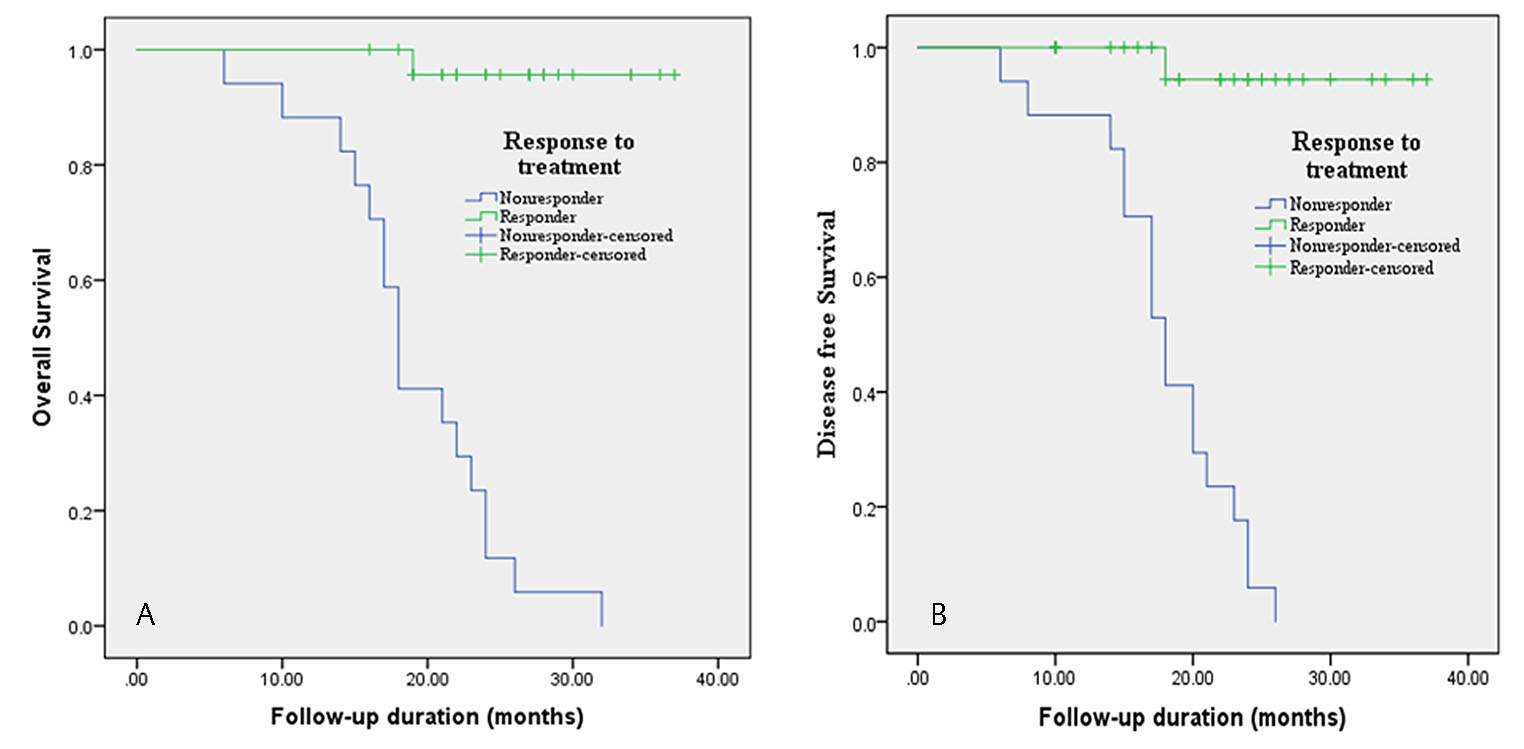
Out of 42 patients, 24 patients survived and 18 passed away. Median of disease-free survival was 19.5 months with mean ± SD of 20.47 ± 7.25 and overall survival median was 22 months with mean ± SD of 22.8 ± 6.71. Overall survival of locoregional recurrence patients was only 14.28% in 3-year follow-up. Overall and disease survival were significantly associated with response to treatment (p < 0.000; Fig. 4A and B). Other factors namely age, sex, tumor stage, differentiation, adverse oral habit and PTPN-14 and WT-1 expression did not show statistically significant correlation with overall and disease-free survival. The results of univariate and multivariate analysis with cox proportional–hazards model for overall and disease-free survival have been shown in Table 5. Patients who responded to chemoradiotherapy have better overall and disease-free survival. The multivariate analysis showed that response to therapy was independent prognostic effect on overall and disease-free survival.
|
Variables |
Univariate analysis |
Multivariate analysis |
Univariate analysis |
Multivariate analysis |
||||||
|---|---|---|---|---|---|---|---|---|---|---|
|
Overall survival |
Disease-free survival |
|||||||||
|
Log rank |
p-Value |
Hazard ratio |
95%CI |
p-Value |
Log rank |
p-Value |
Hazard ratio |
95%CI |
p-Value |
|
|
Age |
0.924 |
0.336 |
0.761 |
0383 |
||||||
|
Sex |
0.310 |
0.578 |
0.040 |
0.842 |
||||||
|
Lymph node metastasis |
0.624 |
0.430 |
1.07 |
0.300 |
||||||
|
Tumor stage |
0.359 |
0.549 |
0.081 |
0.776 |
||||||
|
Tumor differentiation |
1.71 |
0.424 |
3.10 |
0.212 |
||||||
|
Tobacco chewing habit |
0.070 |
0.791 |
0.669 |
0.413 |
||||||
|
Alcohol |
1.46 |
0.227 |
0.525 |
0.469 |
||||||
|
Smoking |
0.558 |
0.455 |
0.268 |
0.604 |
||||||
|
Tobacco+ alcohol |
1.22 |
0.268 |
1.06 |
0.302 |
||||||
|
Tobacco+ smoke |
0.687 |
0.407 |
1.45 |
0.228 |
||||||
|
Alcohol+ smoke |
0.786 |
0.375 |
0.345 |
0.557 |
||||||
|
Tobacco+ alcohol+ smoke |
1.66 |
0.198 |
1.85 |
0.173 |
||||||
|
Response to chemoradiotherapy |
39.62 |
0.000 |
46.10 |
6.08–349.32 |
0.000 |
33.606 |
0.000 |
0.025 |
0.003–0.191 |
0.000 |
|
PTPN-14 IHC expression (score 0–4 vs. 5–12) |
0.725 |
0.394 |
1.21 |
0.271 |
||||||
|
WT-1 IHC expression (score 0–4 vs. 5–12) |
0.158 |
0.691 |
0.045 |
0.831 |
||||||
Abbreviations: 95% CI, 95% confidence interval; IHC, immunohistochemistry; OSCC, oral squamous cell carcinoma; PTPN-14, protein tyrosine phosphatase nonreceptor type 14; WT-1, Wilms’ tumor 1.
-
Fig. 4 Survival analysis with respect to treatment.(A) Kaplan–Meier overall survival curve in correlation with response to chemoradiotherapy treatment. (B) Kaplan–Meier disease-free survival curve in correlation with response to chemoradiotherapy treatment.
Discussion
Oral squamous cell carcinoma is an aggressive malignant tumor of the head and neck, still now it is challenging disease for treatment and locoregional recurrence. It is often classified as one disease, although the region anatomically consists of several distinct structures. For the whole group of this disease, the overall 5-year survival has not improved significantly over the last decades19 and still is relatively low, around 60%.20 The poor survival rate has been ascribed to late detection, a high frequency of relapses, and death due to co morbidity. There is urgent need of identifying factors that affect the recurrence of OSCC to reduce postoperative recurrence.
This study was focused to find biomarker for locoregional recurrence. We explored the factors associated with locoregional recurrence of OSCC like lymph node status, tumor differentiation that is already known for recurrence. Still there are no biomarkers for locoregional recurrence, so in this study we see the expression of tumor suppressor genes, PTPN-14 and WT-1, both at gene and protein level and tried to find biomarker of locoregional recurrence. This study included 96 cases of OSCC and 32 healthy controls and all the patients were followed up for 3 years. Only 42 patients who underwent chemoradiotherapy treatment was successfully followed up for 3 years.
Locoregional recurrence rates of patients with head and neck cancer generally vary between 9 and 59% and 90% of cases recurred within 3 years of primary treatment.21,22 It has reported that the 5-year survival rate was 92% in OSCC patients without recurrence and 30% in patients with recurrence in 5-year follow-up study. In this study, we also found that recurrence was observed in 10 (23.80%) out of 42 patients in 3 years of follow-up. Mean ± SD of locoregional recurrence time was 25.48 ± 5.77 months. The 3-year survival rate was 42.85% without recurrence and 14.28% with recurrence. The median overall survival and disease-free survival in patients without recurrence were 26 and 23.5 months, respectively.
Current study reports that expression of PTPN-14 and WT-1 is upregulated in OSCC as compared with controls both at gene and protein level. Although both genes have tumor suppressor role, we found aberrant expression in OSCC. PTPN-14-positive cases were 67.70% and WT-1-positive cases were 84.37% in OSCC as compared with controls. No significant association of PTPN-14 and WT-1 was observed with clinicopathological factors, tumor stage and differentiation, lymph node status, and adverse oral habits. In this study, we determined the serum concentration of PTPN-14 and WT-1 in pre- and post-chemoradiotherapy samples and found that pre-chemoradiotherapy has higher concentration than post-chemoradiotherapy. Consistent with these results, Mikami et al17 demonstrated that overexpression of WT-1 protein and mRNA in cell lines and OSCC cases concentrated mainly in the cytoplasm of the outer one to three cell layers of the cancer nests. Nagel et al23 also studied the upregulation of WT-1 mRNA in tumors of epithelial/myoepithelial phenotype and implied a potential role of WT-1 in the genesis and/or cellular differentiation of salivary gland tumors. Oji et al24 also demonstrated overexpression of WT-1 in head and neck carcinoma.
To the best of our knowledge, this is the first study of PTPN-14 expression in OSCC. Earlier PTPN-14 study was reported as a novel sperm-motility biomarker.25 Although the expression of PTPN-14 should be downregulated in OSCC, we found its upregulation from normal to OSCC. This aberrant expression might be due to mutations. PTPN-14 has been mutated in colon, breast, head and neck, kidney, liver, ovarian, and skin cancers,26,27,28,29,30 providing genetic evidence suggesting that it plays a role in tumorigenesis. There are a few studies that have observed aberrant expression and alteration in YAP target gene expression. Twenty-three percent of skin basal carcinomas exhibit loss-of-function and deleterious missense mutations in PTPN-1431 that show PTPN-14 cellular functions as a negative regulation of yes-associated Protein 1 (YAP1) downregulation of PTPN-14 in mammary epithelial cells recapitulated YAP1 overexpression causes oncogenic transformation.3,32 This study suggests tongue is most prominent site for recurrence (40%). Unlike many studies, this study demonstrated buccal mucosa is most prominent site for recurrence.18 The possible cause may be due to aggressive nature of the disease or inappropriate treatment. This may be also due to etiology of carcinogenesis. Mukoyama et al33 demonstrated primary site tongue and positive surgical margin and/or extra capsular extension showed that a pathological tumor volume of ≥18 cm 3 was significantly correlated with shorter overall survival (p < 0.01) and local recurrence-free survival (p < 0.01).
In this study, expression of PTPN-14 (p < 0.047) and WT-1 (p < 0.031) and tumor margins (p < 0.041) was significantly associated with tumor locoregional recurrence. Expression of PTPN-14 and WT-1 was also correlated with chemoradiotherapy treatment. The reason for development of recurrence may be existence of transformed cells in areas adjacent to the primary tumor. Presence of molecular changes in the area around tumors was suggested already six decades ago as field cancerization.34 Tumor recurrences develop when tumor cells are not successfully eliminated by treatment and second primary tumors are caused by an independent carcinogenetic process.35 Numerous factors have been suggested as predictive of recurrence such as tumor stage, nodal status, tumor thickness/diameter, and positive surgical margins.36,37,38 The genetic alterations related to the neoplastic process are detectable within 7 cm from the tumor39 Expression of PTPN-14 and WT-1 and tumor margins was significantly associated with locoregional recurrence. Hosni et al40 reported that 15% of advanced OSCC patients intended for postoperative radiotherapy treatment developed early recurrence and identified oral tongue subsite, pT3–4 category, and microscopic positive surgical margin (s) as risk factor for early recurrence. In our study, we did not find any association of lymph node, tumor stage, and differentiation with locoregional recurrence.
Conclusion
This study concludes that PTPN-14 and WT-1 both have been aberrant expression in OSCC inconsistent with their tumor suppressor role. PTPN-14 and WT-1 may be used as biomarker for locoregional recurrence. The rationale of this study was therefore to understand the biology of the recurrent OSCC using gene expression profiles deriving the molecular aspect and phenotypic level to derive new emergent strategies in future for this aggressive cancer. These findings indicate the need of multimodal management of OSCC and a long follow-up. Further validation is required on larger sample size and long follow-up period.
Conflict of Interest
None declared.
Funding All the authors are thankful for financial support to ICMR-HRD DHR for women scientist fellowship to Dr. Seema Nayak (grant No. DHR/HRD/Women Scientist/Type-V/4/2014–15).
References
- Impact of recurrence interval on survival of oral cavity squamous cell carcinoma patients after local relapse. Otolaryngol Head Neck Surg. 2007;136(01):112-118.
- [Google Scholar]
- Survival analysis and risk factors for recurrence in oral squamous cell carcinoma: does surgical salvage affect outcome? J Oral Maxillofac Surg. 2010;68(06):1270-1275.
- [Google Scholar]
- A study of epidemiologic and recurrence factors of oral cancer. J Oral Maxillofac Surg. 2012;70(09):2205-2210.
- [Google Scholar]
- Clinical and genetic signatures of local recurrence in oral squamous cell carcinoma. Arch Oral Biol. 2018;95:141-148.
- [Google Scholar]
- Expression of urokinase-type plasminogen activator and its receptor in squamous cell carcinoma of the oral tongue. Braz Oral Res. 2018;32:e93.
- [Google Scholar]
- Role of CDKN2A/p16 expression in the prognostication of oral squamous cell carcinoma. Oral Oncol. 2017;73:27-35.
- [Google Scholar]
- Identification of a gene expression signature associated with recurrent disease in squamous cell carcinoma of the head and neck. Cancer Res. 2004;64(01):55-63.
- [Google Scholar]
- Protein tyrosine phosphatases and breast cancer. Crit Rev Oncol Hematol. 2004;52(01):9-17.
- [Google Scholar]
- Mutational analysis of the tyrosine phosphatome in colorectal cancers. Science. 2004;304:1164-1166. (5674)
- [Google Scholar]
- Identification and functional characterization of p130Cas as a substrate of protein tyrosine phosphatase nonreceptor 14. Oncogene. 2013;32(16):2087-2095.
- [Google Scholar]
- The protein tyrosine phosphatase Pez is a major phosphatase of adherens junctions and dephosphorylates beta-catenin. Mol Biol Cell. 2003;14(06):2520-2529.
- [Google Scholar]
- Translocation of protein tyrosine phosphatase Pez/PTPD2/PTP36 to the nucleus is associated with induction of cell proliferation. J Cell Sci. 2000;113:3117-3123. (Pt 17)
- [Google Scholar]
- The protein tyrosine phosphatase Pez regulates TGFbeta, epithelial-mesenchymal transition, and organ development. J Cell Biol. 2007;178(07):1223-1235.
- [Google Scholar]
- Tumor suppressive protein phosphatases in human cancer: emerging targets for therapeutic intervention and tumor stratification. Int J Biochem Cell Biol. 2018;96:98-134.
- [Google Scholar]
- WT1 in disease: shifting the epithelial-mesenchymal balance. J Pathol. 2012;226(02):229-240.
- [Google Scholar]
- Transcriptional repression of tumor suppressor CDC73, encoding an RNA polymerase II interactor, by Wilms tumor 1 protein (WT1) promotes cell proliferation: implication for cancer therapeutics. J Biol Chem. 2014;289(02):968-976.
- [Google Scholar]
- Expression of Wilms’ tumor 1 (WT1) in oral squamous cell carcinoma. J Oral Pathol Med. 2013;42(02):133-139.
- [Google Scholar]
- Tissue and serum expression of TGM-3 may be prognostic marker in patients of oral squamous cell carcinoma undergoing chemo-radiotherapy. PLoS One. 2018;13(06):e0199665.
- [Google Scholar]
- Retrospective study of survival and treatment pattern in a cohort of patients with oral and oropharyngeal tongue cancers from 1987 to 2004. Oral Oncol. 2007;43(02):150-158.
- [Google Scholar]
- Metastatic squamous cell carcinoma of the neck from an unknown primary: management options and patterns of relapse. Head Neck. 2002;24(03):236-246.
- [Google Scholar]
- Treatment outcomes of unknown primary squamous cell carcinoma of the head and neck. PLoS One. 2018;13(10):e0205365.
- [Google Scholar]
- Oral squamous cell carcinoma: clinicopathological features in patients with and without recurrence. ORL J Otorhinolaryngol Relat Spec. 2011;73(03):170-176.
- [Google Scholar]
- Analysis of the tumour suppressor genes, FHIT and WT-1, and the tumour rejection genes, BAGE, GAGE-1/2, HAGE, MAGE-1, and MAGE-3, in benign and malignant neoplasms of the salivary glands. Mol Pathol. 2003;56(04):226-231.
- [Google Scholar]
- Overexpression of the Wilms’ tumor gene WT1 in head and neck squamous cell carcinoma. Cancer Sci. 2003;94(06):523-529.
- [Google Scholar]
- Protein tyrosine phosphatase non-receptor type 14 is a novel sperm-motility biomarker. J Assist Reprod Genet. 2011;28(09):851-861.
- [Google Scholar]
- The consensus coding sequences of human breast and colorectal cancers. Science. 2006;314:268-274. (5797)
- [Google Scholar]
- The mutational landscape of head and neck squamous cell carcinoma. Science. 2011;333:1157-1160. (6046)
- [Google Scholar]
- Inactivating mutations of the chromatin remodeling gene ARID2 in hepatocellular carcinoma. Nat Genet. 2011;43(09):828-829.
- [Google Scholar]
- Somatic mutations of the histone H3K27 demethylase gene UTX in human cancer. Nat Genet. 2009;41(05):521-523.
- [Google Scholar]
- NISC Comparative Sequencing Program. Exome sequencing identifies GRIN2A as frequently mutated in melanoma. Nat Genet. 2011;43(05):442-446.
- [Google Scholar]
- Genomic analysis identifies new drivers and progression pathways in skin basal cell carcinoma. Nat Genet. 2016;48(04):398-406.
- [Google Scholar]
- PTPN14 interacts with and negatively regulates the oncogenic function of YAP. Oncogene. 2013;32(10):1266-1273.
- [Google Scholar]
- Pathological tumor volume predicts survival outcomes in oral squamous cell carcinoma. Oncol Lett. 2018;16(02):2471-2477.
- [Google Scholar]
- Field cancerization in oral stratified squamous epithelium; clinical implications of multicentric origin. Cancer. 1953;6(05):963-968.
- [Google Scholar]
- Molecular events in relapsed oral squamous cell carcinoma: recurrence vs. secondary primary tumor. Oral Oncol. 2015;51(08):738-744.
- [Google Scholar]
- Local recurrences and second primary tumors from squamous cell carcinoma of the oral cavity: a retrospective analytic study of 500 patients. Head Neck. 2009;31(09):1168-1180.
- [Google Scholar]
- The prognostic significance of histological features in oral squamous cell carcinoma. J Oral Pathol Med. 2009;38(08):657-662.
- [Google Scholar]
- Tumour thickness and relationship to locoregional failure in cancer of the buccal mucosa. Eur J Surg Oncol. 1999;25(02):186-189.
- [Google Scholar]
- A genetic progression model of oral cancer: current evidence and clinical implications. J Oral Pathol Med. 2004;33(06):317-322.
- [Google Scholar]
- Lymph node ratio relationship to regional failure and distant metastases in oral cavity cancer. Radiother Oncol. 2017;124(02):225-231.
- [Google Scholar]