Translate this page into:
Association between Adenoid-Nasopharyngeal Ratio and Tympanogram Width in Adenoid Hypertrophy Patients
Address for correspondence Haris Mayagung Ekorini, Department of Otorhinolaryngology Head and Neck Surgery, Faculty of Medicine, Universitas Airlangga–Dr. Soetomo General Academic Hospital, Jl. Mayjend Prof. Dr. Moestopo No. 6-8, Airlangga, Gubeng, Surabaya, East Java 60286, Indonesia. harismayaguyangekorini@gmail.com
This article was originally published by Thieme Medical and Scientific Publishers Pvt. Ltd. and was migrated to Scientific Scholar after the change of Publisher.
Abstract
Introduction Adenoid hypertrophy is a change in adenoid size that can lead to obstruction the Eustachian tube and become a risk factor for otitis media effusion (OME) in children. Standard objective examination of adenoid hypertrophy uses adenoid-nasopharyngeal ratio (A-N ratio) based on correct lateral skull radiography. Adenoid hypertrophy is one of the factors causing OME in children. There is still much debate about the association between A-N ratio and tympanogram width (Tw). Determining the association of A-N ratio and Tw in adenoid hypertrophy patients.
Methods Participants performed a true lateral radiographic examination using Fujioka method to determine A-N ratio, and Tw to determine middle-ear pressure. The distance between examination of A-N ratio and tympanogram examination was at maximum of ∼1 week. The association between A-N ratio and Tw in patients with adenoid hypertrophy used the Pearson correlation test. This research employed significance level p < 0.05.
Results Most participants were aged between 6 and 10 years (38.10%), male patients (57.14%), and the symptom most participants complained of was snoring during sleep (38.10%). Most participants had A-N ratio of 0.53 to 0.70 (61.90%) with an average of 0.60 ± 0.05. The average value of Tw measurement was 102.83 ± 50.03 daPa (r = 0.605; p < 0.001).
Conclusion There is a significant association between A-N ratio base on true lateral radiographic examination and Tw in adenoid hypertrophy patients.
Keywords
adenoid- nasopharyngeal ratio
adenoid hypertrophy
tympanogram width

Introduction
Adenoid hypertrophy is a condition of increased adenoid size. Long-term adenoid hypertrophy can cause obstruction in the Eustachian tube, and become a risk factor for otitis media with effusion (OME) in children. Supporting standard examinations of adenoid hypertrophy objectively use true lateral radiographs of soft tissue conditions. The examination is available in almost all hospitals, noninvasive, and correlates well with patient symptoms.1,2,3
Middle-ear abnormalities due to adenoid hypertrophy can be identified by tympanometry examination. Tympanometry is the best tool for examining middle-ear abnormalities.4 The type of tympanogram that has been proven accurate to distinguish OME from a healthy middle ear is tympanogram width (Tw). The Tw has a higher sensitivity and specificity compared with tympanogram peak pressure (TPP) and peak static-compensated acoustic admittance (Ytm) of the middle ear, so that it can detect a decrease in middle-ear pressure earlier.5 The Tw has a sensitivity of around 89% and a specificity of 93% at >150 daPa; therefore, it is suitable as the most sensitive and specific parameter for examining middle-ear pressure. The tool is expected to be used as an early diagnosis to prevent OME. This type of Tw examination has not been used routinely, especially in health centers with limited financial resources. The measurement of Tw is a complement of quantitative criteria, making the tympanogram picture more specific and precise to avoid mistakes or misinterpretations. The measurement of Tw, which is the x-axis Tw at 50% of the maximum peak height Ytm expressed in daPa units, is said to be the most sensitive for early diagnosis of OME.6
An adenoid-nasopharyngeal ratio (A-N ratio) > 0.71 as much as 75% indicates middle-ear disorders with tympanograms type B and C, showing the greater A-N ratio, the higher the degree of middle-ear disturbance.4 The increasing adenoid hypertrophy size from mild-to-severe is directly proportional to the increase in tympanogram abnormalities. A study of patients with severe adenoid hypertrophy found that 75% of them had normal tympanogram and 25% with tympanogram abnormalities. Patients with moderate adenoid hypertrophy had normal tympanogram (78.6%) and tympanogram abnormalities (21.4%). Patients with mild adenoid hypertrophy showed tympanogram abnormalities (8.7%).7 Adenoid hypertrophy causes negative middle-ear pressure, with tympanograms of type C and type B. The OME incidence in patients with adenoid hypertrophy is around 55.9%, with more type B tympanograms (29.4%) compared with type C (26.5%).3
Adenoid hypertrophy is found in 58% of children between the ages of 6 months and 15 years, with a peak occurrence at the age of 3 to 7. This abnormality begins to decrease at 8 years old and disappears around the age of 14. The greater the adenoid hypertrophy, the more increasing risk of Eustachian tube dysfunction.8 This dysfunction will disrupt the function of ventilation, protection and drainage, resulting in secrete insufflation into the organ. If the dysfunction persists, negative pressure will form in the middle-ear due to absorption and diffusion of nitrogen and oxygen into the mucosal cells. Persistent negative ear pressure causes increased capillary permeability, resulting in extravasation of fluid into the middle ear, which then causes the accumulation of serous fluid in the form of sterile effusion known as OME.9 The OME can cause mild-to-moderate hearing loss, delayed speech or language, articulation imperfections, communication problems, impaired children's performance at school, and intellectual impairment. Early OME identification is important to prevent various complications and adverse effects in the future.8,10
Based on the description above, it is necessary to conduct a research about the association between A-N ratio based on true lateral head radiography and Tw-based middle-ear pressure in adenoid hypertrophy patients, as there is still limited study in the association between the two variables.
Materials and Methods
Participant
This study involved patients with a diagnosis of adenoid hypertrophy who were treated at Dr. Soetomo General Academic Hospital, Surabaya, Indonesia. The participants should meet the following inclusion criteria: (1) patients should be diagnosed with adenoid hypertrophy; (2) should be aged between 3 and 14 years; (3) should have underwent a true lateral head radiographic examination (A-N ratio) using the Fujioka method with results >0.3. The exclusion criteria included patients with tympanic membrane perforation, tumors, craniofacial abnormalities, concha hypertrophy, septum deviation, nasal trauma, upper respiratory tract infections, laryngopharynx reflux, and allergies. All participants received explanations related to the research aims and procedures, and they should fill out the consent form prior to the study.
Design
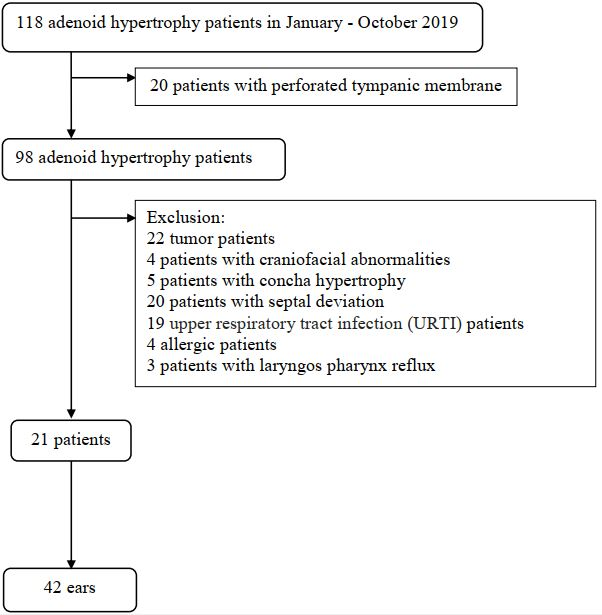
The study took place at Dr. Soetomo General Academic Hospital, Surabaya, Indonesia, from January to October 2019, using a cross sectional study with consecutive sampling method. Participants were examined for true lateral radiography using the Fujioka method to determine A-N ratio, and Tw to determine middle-ear pressure. The distance between A-N ratio examination and tympanometry examination was at maximum of around 1 week. The number of participants in this study were 21 participants (Fig. 1). The researchers performed ethical clearance prior to the study (Ethics Number 1191 / KEPK / V / 2019).
-
Fig. 1 Sampling process in adenoid hypertrophy participant.
A-N Ratio Examination
The A-N ratio was measured using the results of Fujioka’s true lateral radiographic. The researchers measured adenoids enlargement shown in the lateral skull photo of soft tissue conditions by comparing ratio of adenoid hypertrophy with nasopharyngeal distance. The radiography examination of true lateral head used X-ray Tube Assembly (UH-6FC-31E; Hitachi Medical Co., Tokyo, Japan). The measurement of A-N ratio was performed by radiologist who had taken consultant education. The measurement results of the A-N ratio were divided into three, namely mild (0.30–0.50), moderate (0.51–0.70), and severe (≥0.71).11,12
Tympanogram Width Measured
Tw is the width of the x-axis of tympanogram at 50% of the maximum height of static acoustic admittance (½ Ytm) expressed in daPa units. The Tw examination used the Grason Stadler GSI 39 screening tympanometer (GSI, Minnesota, United States). The Tw examination was performed by an ENT-Head and Neck specialist with neurotology consultant. The result of ≥ 150 daPa showed a decrease in middle-ear pressure. The sustained results could potentially lead to OME.
Statistical Analysis
The results were analyzed in accordance with their types, which were then presented in tabular form. The measurement data were first tested for normality to determine data distribution. The association between A-N ratio and middle-ear pressure in patients with adenoid hypertrophy was measured using Pearson’s correlation test. This study used significance level of p < 0.05 with 95% confidence interval. Statistical test analysis used the IBM SPSS Statistics software version 21.0 (IBM Corp., Armonk, New York, United States).
Results
Characteristics of Participants
The distribution of participants based on age showed that most patients belonged to the age group of 6 to 10 (8 participants; 38.10%), and followed by the age group of 3 to 5 (7 participants; 33.33%). The youngest and oldest participant’s age was 3 and 14 years, respectively, with the average age of 8.04 years (standard deviation = 3.61 years). Most participants were male (57.14%), with a ratio of 1.33: 1 between male and female. The most frequent symptom experienced by participants was snoring during sleep (8 participants; 38.10%), followed by nasal congestion (6 participants; 28.57%) and ear disorders (5 participants; 23.81%) (Table 1).
|
Characteristics |
n (%) |
|---|---|
|
Age (y) |
|
|
3–5 |
7 (33.33) |
|
6–10 |
8 (38.10) |
|
11–14 |
6 (28.57) |
|
Sex |
|
|
Male |
12 (57.14) |
|
Female |
9 (42.86) |
|
Symptom |
|
|
Nasal congestion |
6 (28.57) |
|
Mouth breathing |
2 (9.52) |
|
Snoring |
8 (38.10) |
|
Ear disorders |
5 (23.81) |
A-N Ratio
Most participants had an A-N ratio of 0.53 to 0.70 (13 participants; 61.90%), with the average value of 0.60 ± 0.05, and followed by an A-N ratio of ≥ 0.70 (5 participants; 23.81%), with the average value of 0.82 ± 0.13. The minimum and maximum A-N ratio were 0.50 and 1.05, respectively (Table 2).
|
A-N ratio |
Mean ± SD |
Min–Max |
n (%) |
|---|---|---|---|
|
0.31–0.52 |
0.51 ± 0.01 |
0.50–0.52 |
3 (14.29) |
|
0.53–0.70 |
0.60 ± 0.05 |
0.54–0.67 |
13 (61.90) |
|
≥0.71 |
0.82 ± 0.13 |
0.72–1.05 |
5 (23.81) |
Abbreviations: A-N ratio, adenoid-nasopharyngeal ratio; SD, standard deviation.
Tympanogram Width
The results of Ytm measurement showed an average of 0.38 ± 0.39 mmho, with minimum and maximum value of 0.070 and 2.470 mmho, respectively. The TPP measurement obtained minimum and maximum value of –284.00 daPa and 27.00 daPa, respectively, with the average value of −37.79 ± 80.53 daPa (Table 3). The results of Tw measurements showed an average value of 102.83 ± 50.03 daPa, with minimum and maximum value of 19.00 and 285.00 daPa, respectively (Table 4).
|
Tympanogram |
Mean ± SD |
Min–Max |
|---|---|---|
|
Ytm (mmho) |
0.070 ± 2.47 |
0.070–2.47 |
|
TPP |
37.79 ± 80.53 |
284.00–27.00 |
Abbreviations: SD, standard deviation; TPP, tympanometric peak pressure; Ytm, peak static-compensated acoustic admittance.
|
Measurement results |
Mean ± SD |
Min–Max |
p-Value |
|---|---|---|---|
|
A-N ratio |
0.64 ± 0.13 |
0.50–1.05 |
0.000a |
|
Tw |
102.83 ± 50.03 |
19.00–285.00 |
Abbreviations: A-N ratio, adenoid-nasopharyngeal ratio; SD, standard deviation; Tw, tympanogram width.
aSignificant < 0.05.
The participant distribution based on the results of tympanogram measurements showed the highest As type with 23 ears (54.76%), followed by type A with a total of 17 ears (40.48%) and Ad and C with 1 ear each (2.38%).
Association between A-N Ratio and Tympanogram Width
Statistical tests showed a correlation between true lateral head radiographs-based A-N ratio and Tw-based middle-ear pressure in patients with adenoid hypertrophy (p < 0.001). Analysis of the association’s strength obtained a value of r = 0.605, indicating a strong positive correlation coefficient between the two variables (Table 4).
Discussion
This study found a significant association between A-N ratio with middle-ear pressure in patients with adenoid hypertrophy. There was a strong positive correlation coefficient between the two variables. This result is in accordance with a study conducted by Wahyudiono and Halim, who obtained a significant correlation between true lateral radiography-based A-N ratio and Tw in adenoid hypertrophy patients (p < 0.01).13 The study of Nwosu et al showed a significant correlation between adenoid hypertrophy and middle-ear disorders in children aged 1 to 10 years (p < 0.05).3 A study conducted by Kiama also obtained a significant correlation between adenoid hypertrophy and the incidence of middle-ear disorders in children aged 1 to 8 years (p < 0.05).14
Adenoid hypertrophy is often found in children and plays an important role in the occurrence of OME. Various studies suggested that adenoid hypertrophy is the most common cause of middle-ear pressure disorders in children. Middle-ear pressure disorders are caused by Eustachian tube dysfunction, such as ventilation, protection, and drainage. A long-term adenoid hypertrophy can result in obstruction of the persistent Eustachian tube ostium thus becoming a risk factor for OME.2,4,15 The OME in children can result in hearing loss, which is a predisposing factor for delayed speech as well as language and academic development.16
Early diagnosis of increased middle-ear pressure in children with adenoid hypertrophy is needed to determine examination techniques with high sensitivity and specificity. Patients with increased middle-ear pressure sometimes do not feel any symptoms, and physical examination is often not specific so the disease becomes difficult to detect. Middle-ear disorders accompanied by OME are often known when patients do routine checks. Delay or failure of early detection of middle-ear pressure disorders with long-term OME can cause hearing loss, slow speech, intellectual development barriers, and middle-ear disorders.17,18
Examination of the true lateral radiographic-based A-N ratio using Fujioka method measures the magnitude of adenoids to be further compared with the nasopharyngeal cavity without observing the effect of adenoid pressure on the anterior or lateral. The anterior hypertrophy of adenoids more often will result in appendicitis and breathing problems. If the problem leads to lateral organ, it is more dominant to interfere Eustachian tube function. Patients without complaints of appendicitis or snoring do not necessarily have no middle-ear disorders.4,15
Middle-ear disorders can be identified using tympanometry examination. The available parameters are Tw, Jerger, Ytm, and TPP type tympanograms. Tympanogram Jerger is most often used to detect middle-ear pressure disorders with a sensitivity of 80%. Type-A tympanogram shows a healthy middle ear, but can obtain 3 to 4% of OME patients.5,16 The Tw has a higher sensitivity and specificity compared with Jerger's tympanogram that is 89 and 93%. The greater the value of Tw, the specificity will increase. The graph of Ytm will decrease at OME so that Tw becomes wider and gradually Ytm will greatly decrease, so the tympanogram becomes type B or flat.19 The maximum width of Tw that can be measured automatically for each ear is 570 daPa.20
Measurement of middle-ear pressure with Tw can explain the tympanogram picture to be more specific and precise to avoid mistakes and misinterpretations.6,21 Research on children of potential adenoid hypertrophy who will undergo myringotomy surgery shows that Tw is the best tympanometry measurement to distinguish between ears with and without OME. A value of Tw> 150 indicates a sensitivity of 95% when used to examine ears with OME and specificity of 93% when performed on ears without OME.19
Toros et al22 who took radiological adenoid hypertrophy measurements obtained different results from this study. Toros et al found no statistically significant difference between adenoid hypertrophy and tympanogram type (p = 0.579). This difference can be caused by differences in the tympanometry parameters used, namely Jerger tympanogram. Jerger tympanogram has a lower sensitivity compared with Tw. Patients with appendicitis, snoring, and breathing through the mouth are selected as samples without considering ear complaints, so it is likely that most of the samples have anterior hypertrophy of the adenoids. Pan et al23 also found different findings, stating no statistically significant difference between Eustachian tube function with A-N ratio (p > 0.05). The difference is caused by two subjects (25%) with A-N ratio >0.71 but do not experience middle-ear disorders (type A). The two samples have the most prominent complaints of appendicitis and rhinorrhea, which are the main symptoms in anterior adenoid hypertrophy or choana. The A-N ratio measurement of true lateral head radiographs cannot describe tubal dysfunction due to adenoid to lateral hypertrophy, but only provides information about adenoid size or degree of obstruction in the nasopharynx.24
The results of this study support the theory of Eustachian tube estuary obstruction by adenoid hypertrophy because a significant correlation is obtained between adenoid hypertrophy and increased Tw. The Tw has the potential to be used as a parameter that can predict the occurrence of OME in patients with adenoid hypertrophy. The results of this study also support the theory of Eustachian tube dysfunction caused by the Toynbee phenomenon in adenoid hypertrophy because there is a significant correlation between the greater value of Tw with the more severe obstruction in nasopharyngeal cavity based on measurement of A-N ratio of true lateral head radiographs using the Fujioka method. The Tw is the most sensitive and specific parameter for assessing middle-ear disorders compared with other parameters. Combined several parameters such as pure tone audiometry, Tw, TPP, Ytm, ECV, and acoustic reflex tests can improve the ability to predict middle-ear disorders.13,19
Conclusion
There is a strong positive association between true lateral head radiography-based A-N ratio and Tw-based middle-ear pressure in patients with adenoid hypertrophy. Adenoid enlargement will expand Tw, so it has the potential for early detection of middle-ear pressure disorders that can be related to OME.
Acknowledgment
We would like thank to Fis Citra Ariyanto for helping us in editing and proofreading our manuscript.
Conflict of Interest
None declared.
References
- Eustachian tube dysfunction of adenoid origin. therapeutics. Pharmacology and Clinical Toxicology. 2010;XIV:36-40.
- [Google Scholar]
- The effect of the adenoid hypertrophy rate on upper airway obstruction symptoms. KKB-Foum. 2011;11(10):74-79.
- [Google Scholar]
- Tympanometric findings among children with adenoid hypertrophy in Port Harcourt, Nigeria. Int J Otolaryngol. 2016;2016:1276543.
- [CrossRef] [Google Scholar]
- Adenoid-nasopharyngeal ratio and middle ear disorder in patients with adenoid hypertrophy. J Indonesian Med Assoc. 2013;63(01):5-9.
- [Google Scholar]
- Tympanometry and Spectral Gradient Acoustic Reflectometry in the Diagnosis of Otitis Media in Young Children. Turun yliopisto University of Turku 2015:4-84.
- [Google Scholar]
- 2017. Handbook of Clinical Audiology. 7th edition. Philadelphia: Wolters Kluwer Lippincott Williams & Wilkins
- The effect of adenoid size on tympanometric finding in children. Zanco Journal of Medical Sciences. 2016;20:1396-1403.
- [Google Scholar]
- Oral steroids for the resolution of otitis media with effusion (OME) in children (OSTRICH): study protocol for a randomised controlled trial. Trials. 2016;17(01):115.
- [Google Scholar]
- Role of adenoid hypertrophy in causation of chronic middle ear effusion. Int J Otorhinolaryngol Head Neck Surg. 2017;4:203.
- [CrossRef] [Google Scholar]
- Diagnostic accuracy of otitis media with effusion in children. Mustansiriya Medical Journal. 2016;15(01):1-6.
- [Google Scholar]
- Adenoid enlargement assessment by plain X-ray & nasoendoscopy. IRAQI JOURNALOF COMMUNITY MEDICINE. 2012;25(01):88-91.
- [Google Scholar]
- Diagnostic accuracy of radiology and endoscopy in the assessment of adenoid hypertrophy. Int J Otorhinolaryngol Clin. 2017;9
- [CrossRef] [Google Scholar]
- Relationship of tympanogram width (Tw) with adenoid hypertrophy: predictor of otitis media with effusion occurrence in adenoid hypertrophy: presenting author: Ahmad Dian Wahyudiono. J Laryngol Otol. 2016;130:S241-S242. (S3)
- [Google Scholar]
- Kiama A. Prevalence of Otitis Media with Effusion in Children with Obstructive Adenoid Disease Compared with Normal Controls Kenyatta National Hospital. Final dissertation for the degree of Master of Medicine in Ear, Nose and Throat Head and Neck Surgery, at the University Of Nairobi; 2014
- Tympanometry as a predictor factor in the evolution of otitis media with effusion. J Med Life. 2012;5(04):452-454.
- [Google Scholar]
- Normative values for tympanometry in 4-5-year-old children. Int J Audiol. 2003;42(06):327-330.
- [Google Scholar]
- The effect of adenoid hypertrophy on tympanometric findings in children without hearing loss. Kulak Burun Bogaz Ihtis Derg. 2014;24(06):334-338.
- [Google Scholar]
- Risk factors for otitis media effusion in children who have adenoid hypertrophia. Int J Pediatr Otorhinolaryngol. 2015;79(03):374-377.
- [Google Scholar]
- 2014. Bluestone and Stool’s pediatric otolaryngology. 5th edition. New York: Shelton: People’s Medical Publishing House
- Tympanometric findings and the probability of middle-ear effusion in 3686 infants and young children. Pediatrics. 2006;118(01):1-13.
- [Google Scholar]
- 2015. et al. Cummings Pediatric Otolaryngology. 1st edition. Philadelphia: Elsevier Health Sciences
- Does adenoid hypertrophy really have effect on tympanometry? Int J Pediatr Otorhinolaryngol. 2010;74(04):365-368.
- [Google Scholar]
- [Relationship between adenoids hypertrophy and tympanogram/eustachian tube function in children] Lin Chuang Er Bi Yan Hou Ke Za Zhi. 2005;19(22):1015-1016.
- [Google Scholar]
- Lateral neck radiography versus direct video rhinoscopy in assessing adenoid size. J Otolaryngol. 2004;33(06):360-365.
- [Google Scholar]